fabric-iq
Manually build an e-commerce ontology and data agent in Microsoft Fabric IQ
One out-of-stock desk, four orders that look like they're waiting but only two really are, and eight CSV files that each hold part of the answer. A step-by-step build of the Fabric IQ ontology, and the data agent that finally answers the question.
The best product City Cart sells is a standing desk. It's the highest rated thing in the catalogue and the most expensive item on the site.
Right now it's out of stock. Somewhere out there are customers who have paid for one that hasn't even been picked yet.
The ops lead asks the obvious question: who's blocked waiting on that desk, where are they, and which seller is supposed to be shipping it?
Simple question. The company's own data holds every piece of the answer. Watch what happens when you try to get it out.
Eight tables, none of them the answer
City Cart is an online marketplace. Sellers list products, customers across India buy them, and the whole business runs on eight tables: customers, orders, order items, products, sellers, categories, cities, order status.
Each table is clean. Each one reads fine on its own.
products.csv knows the desk has no stock. order_items.csv knows which order lines point at it. orders.csv knows which orders those lines belong to and where each one got stuck. customers.csv knows who placed them. cities.csv knows where those people live. sellers.csv knows who's meant to be shipping. Six files hold six fragments of one answer, and not one of them holds the answer.
The only thing joining them is you. You know ProductID in order items points back at products. You know CityID in customers points at cities. Nothing in the data says so. You just know, and so you write the join by hand, and so does the next person, slightly differently.
Then there's the trap underneath the joins. Four desk orders have no delivery date, so the obvious query hands back four names. One of those was cancelled. Another already shipped, and a shipped desk left the warehouse, which means that unit was in stock when it went out. Only two orders are genuinely blocked.
Getting that right needs more than a join. It needs to know what Processing and Shipped mean to this business. No column says it.
That's the real problem, stated precisely: the connections between these tables are completely real, but they're not written down anywhere the platform can read them. They live in your head. They leave when you do.
What an ontology does about it
An ontology writes them down, once.
You name the things the business actually has: Customer, Order, OrderItem, Product, Seller. You name the links between them: an order is placed by a customer, a line item is part of an order and refers to a product. Then you point each name at a real column in a real table.
Fabric IQ takes that and builds a knowledge graph. After that the connections are facts the platform holds, not steps you retype. The desk question stops being a six table join and becomes a walk: start at the desk, step to the order lines that mention it, step up to their orders, step across to those customers and their cities.
Same data. It just knows what it is now.
The rest of this article builds that graph, start to finish. By the end, a data agent answers the desk question in plain English, grounded on the graph instead of guessing.
Part 1: land the data in a lakehouse
Ontology binds to tables, so the tables have to exist first.
1.1 Create the workspace
Open app.fabric.microsoft.com and sign in with your Fabric account.
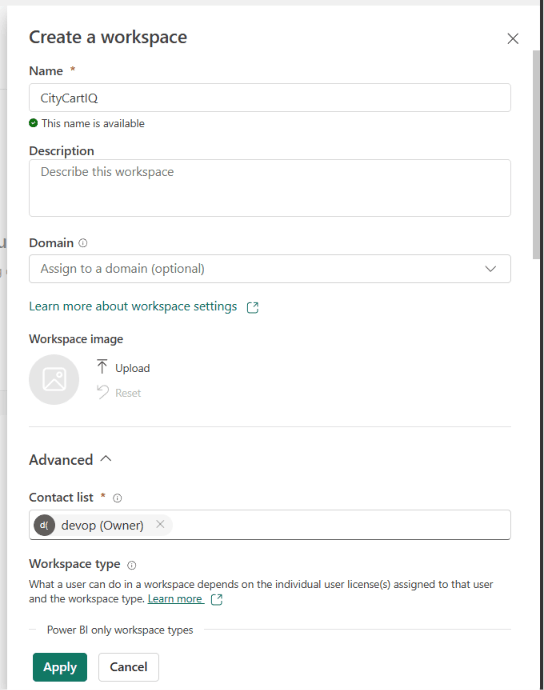
Select Workspaces in the left nav, then + New workspace. Name it CityCartIQ and wait for the green "name is available" tick.
1.2 Set the workspace type to Fabric
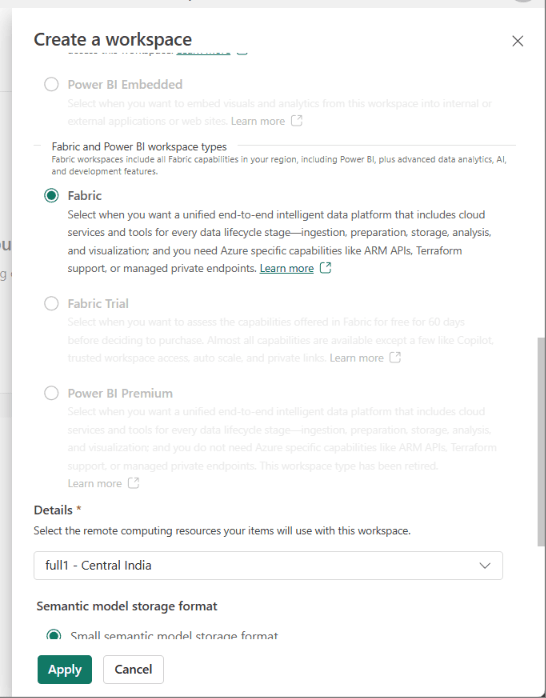
Still in that same dialog, scroll down and open Advanced. This part matters more than it looks.
- Under Workspace type, pick Fabric. The Power BI options above it won't run an ontology.
- Under Details, choose your capacity from the dropdown.
- Select Apply.
1.3 Create the lakehouse
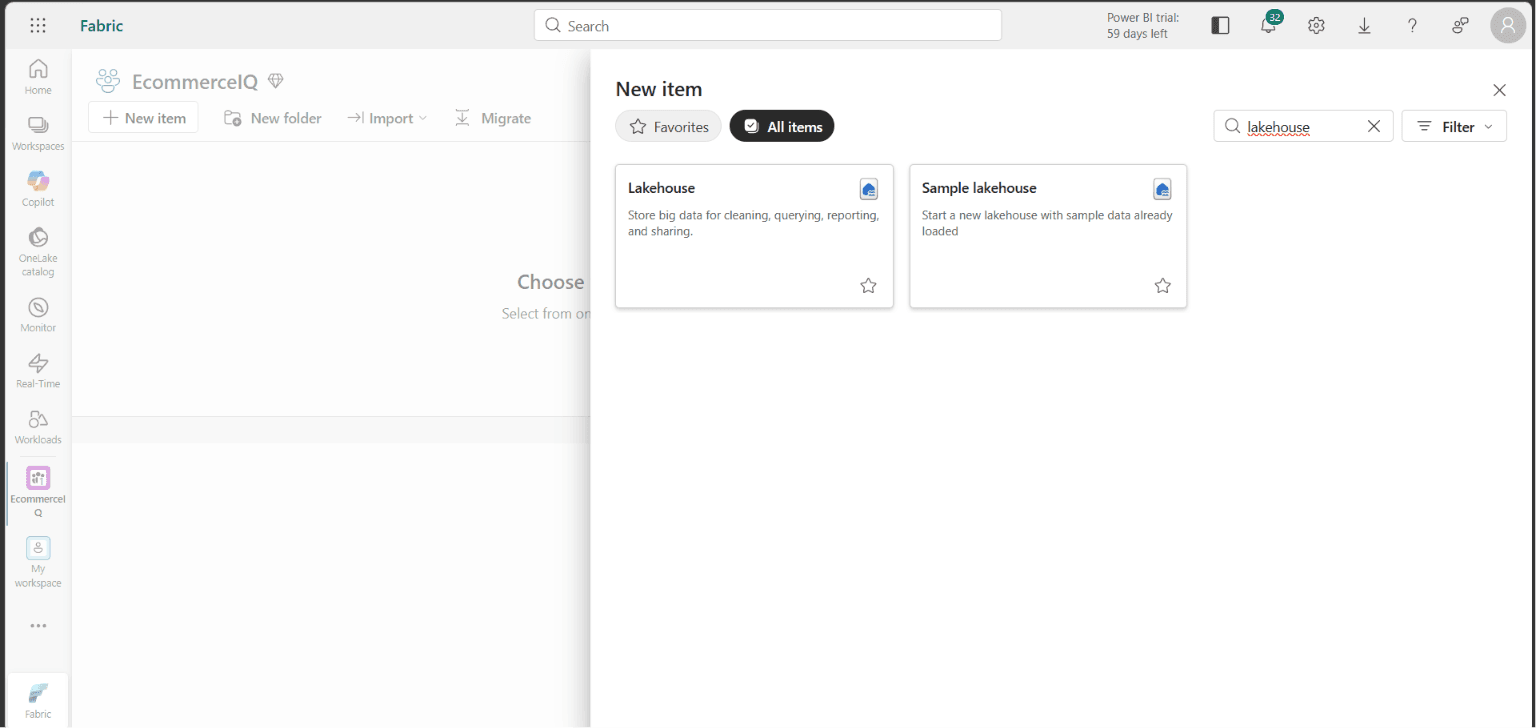
In the workspace, select + New item. Search for lakehouse and pick the Lakehouse card. Not Sample lakehouse, that one arrives pre-loaded with data you don't want.
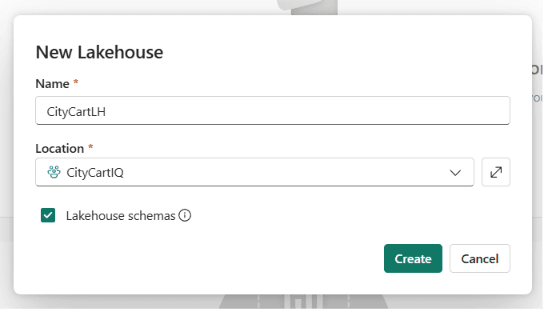
Name it CityCartLH, leave the defaults as they are, and select Create.
1.4 Upload the eight CSVs
First, get the eight CSVs. Grab them all as a single ZIP, or browse them in the project data repo, which also has a README describing every column and how the tables connect.
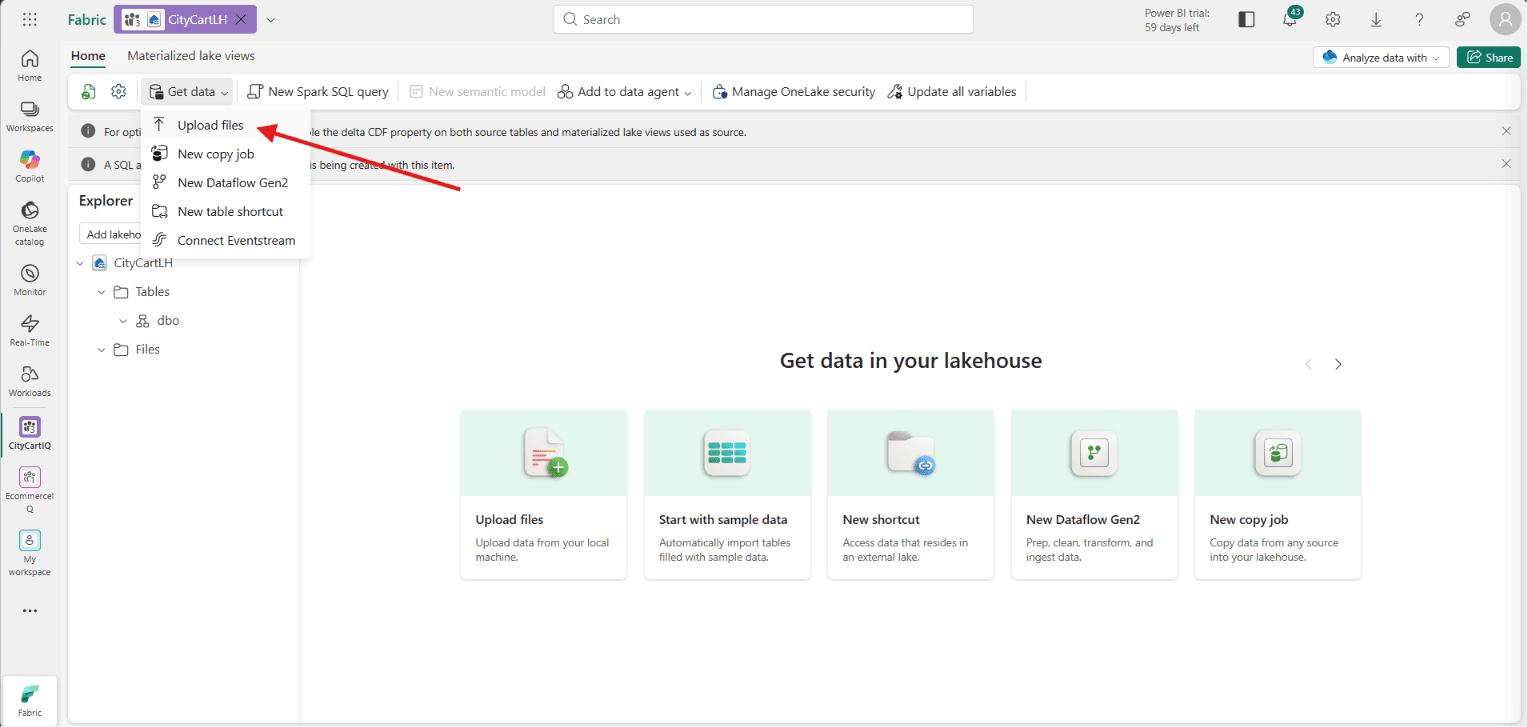
Back in the lakehouse, the Get data in your lakehouse screen opens. Select the Upload files tile.
Upload all eight: customers.csv, orders.csv, order_items.csv, products.csv, sellers.csv, categories.csv, cities.csv, order_status.csv. Select Files in the explorer afterwards and confirm you see eight items.
1.5 Load each file to a table
Files are just files sitting in storage. Ontology binds to Delta tables, so each CSV needs converting. There are two ways to do it, below. Pick one, not both. They load the same eight tables, so running both just overwrites your work and spends capacity twice. Method 1 is the one to use.
Method 1: one notebook cell (recommended)
This writes all eight tables in a single Spark session, so it never trips the capacity limit the manual clicks can (more on that below).
- In the workspace, select + New item, then Notebook. Name it
Load CityCart data. - In the notebook's left Explorer, select Add data items, then From OneLake catalog. Pick CityCartLH and select Connect.
CityCartLHnow shows under Explorer. Hover it, select the pin icon (or its ⋯ menu), and set it as the default lakehouse. This is what the relativeFiles/path in the code resolves against.- Paste this into the first cell and select Run. One Spark session writes all eight tables and prints each as it lands:
tables = ["customers", "orders", "order_items", "products",
          "sellers", "categories", "cities", "order_status"]

for t in tables:
    (spark.read
        .option("header", "true")
        .option("inferSchema", "true")
        .csv(f"Files/{t}.csv")
        .write.mode("overwrite").format("delta")
        .saveAsTable(f"dbo.{t}"))
    print(f"loaded {t}")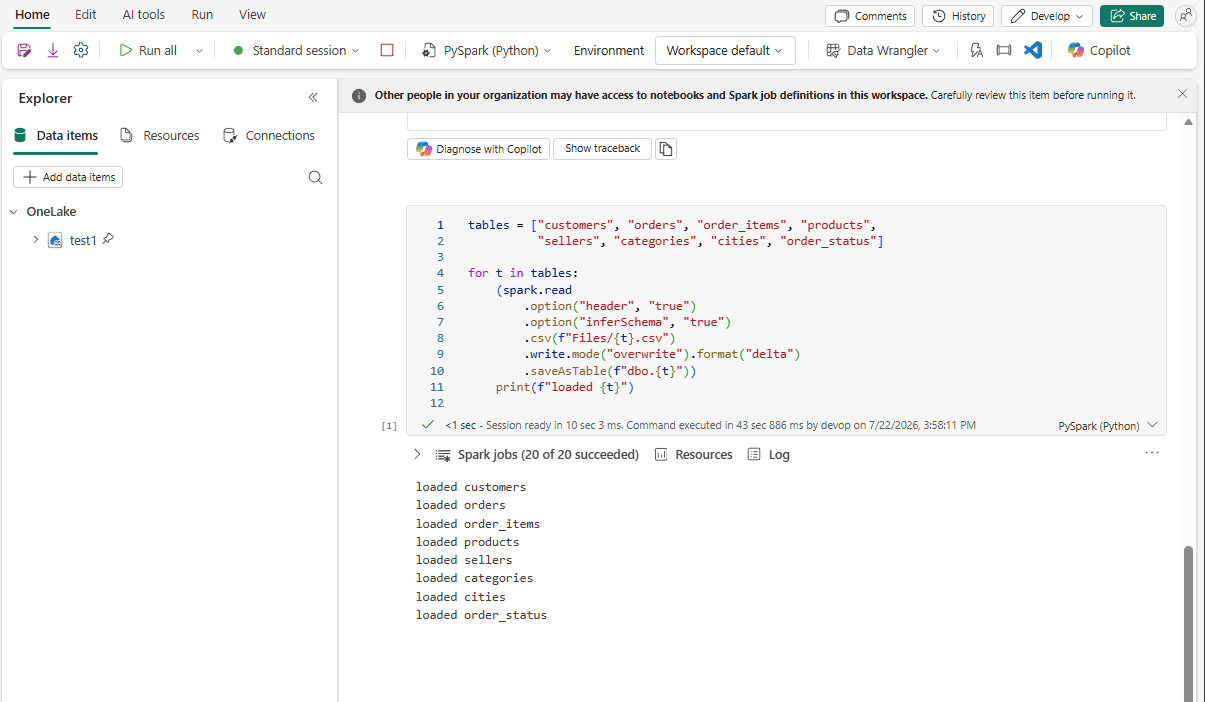
Method 2: load each file by hand
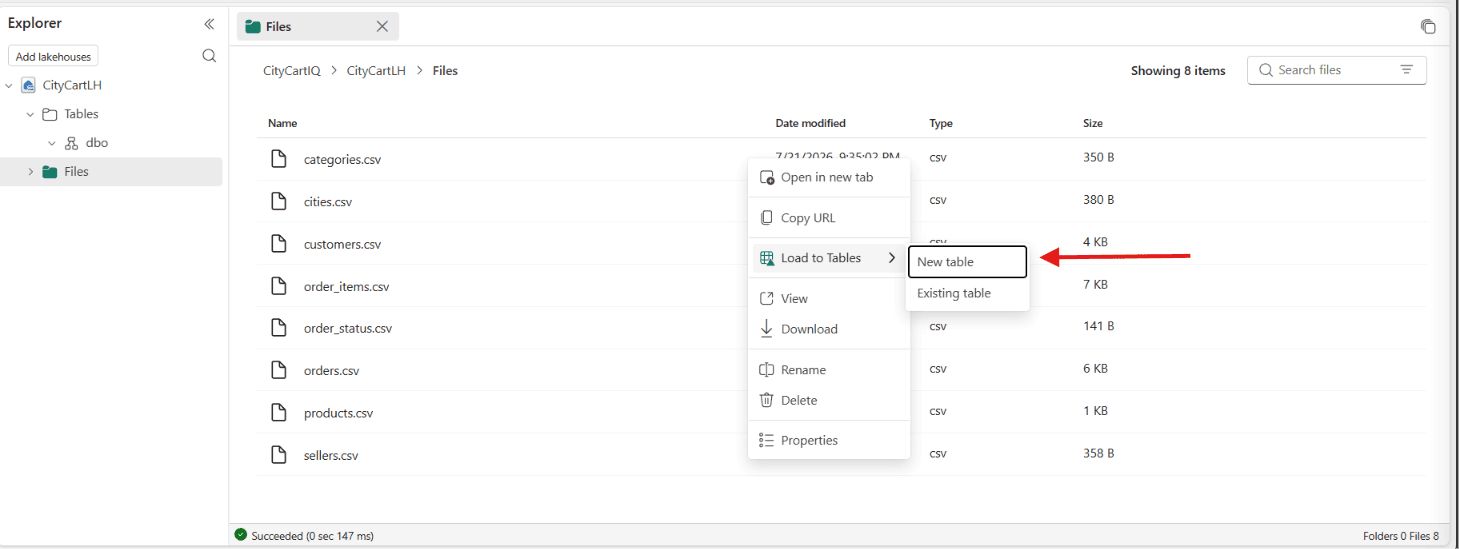
Use this only if you skipped Method 1. In the lakehouse, under Files, right click a CSV, select Load to Tables, then New table. A dialog opens with four fields:
- Keep Schema as
dbo. - Keep the suggested table name.
- Leave Use header for column names ticked.
- Select Load.
Repeat for all eight files. Clicking through it once is worth doing the first time, because you see exactly what each step produces. But read the box below before you fire off eight in a row.
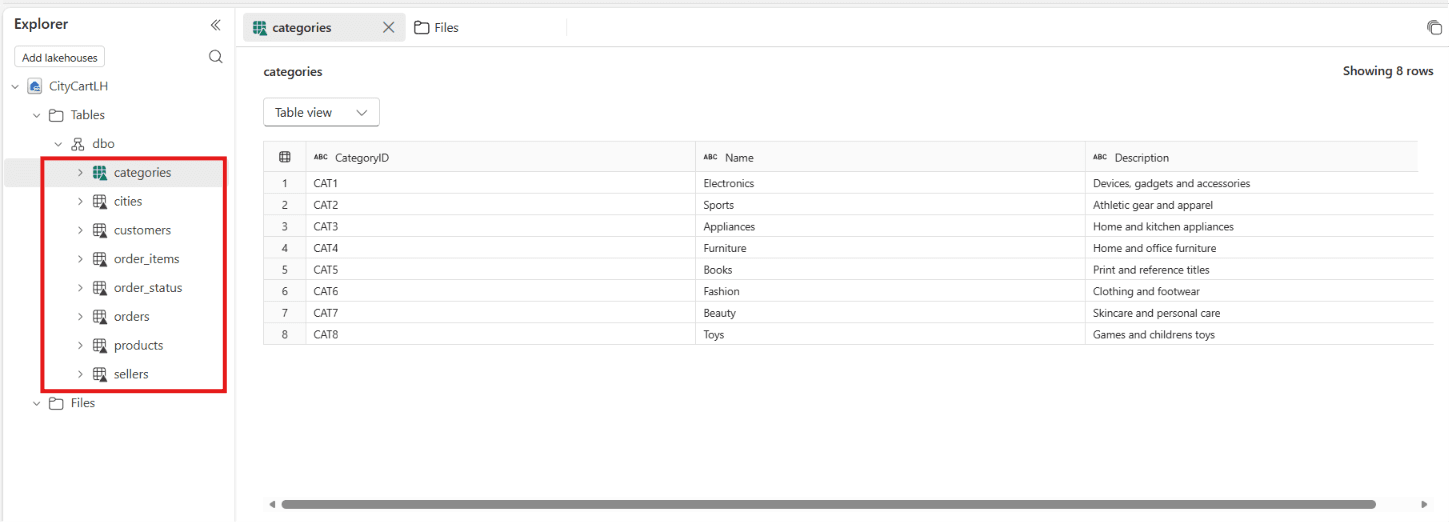
Whichever method you used, go back to the lakehouse and expand Tables, then dbo. All eight should be there. Check the row counts:
| Table | Expected rows |
|---|---|
customers | 60 |
orders | 121 |
order_items | 256 |
products | 40 |
sellers | 8 |
categories | 8 |
cities | 12 |
order_status | 5 |
That's the data landed. Nothing here is ontology yet. You've just got eight tables and no idea how they connect, which is precisely the problem the next part solves.
Part 2: create the ontology and its entity types
Eight tables sitting in a lakehouse. Nothing in them says how they connect. Time to fix that.
2.1 Create the ontology
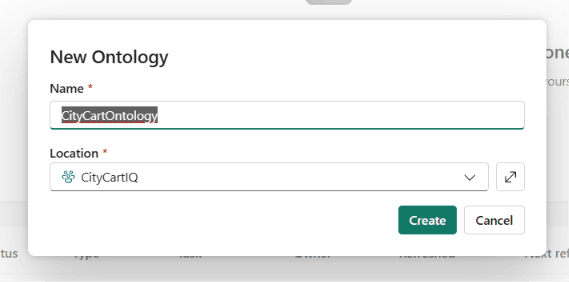
In the workspace, select + New item, then Ontology (preview). Name it CityCartOntology.
2.2 Add the first entity type
An empty ontology opens. Select + Add entity type and name the first one Customer.
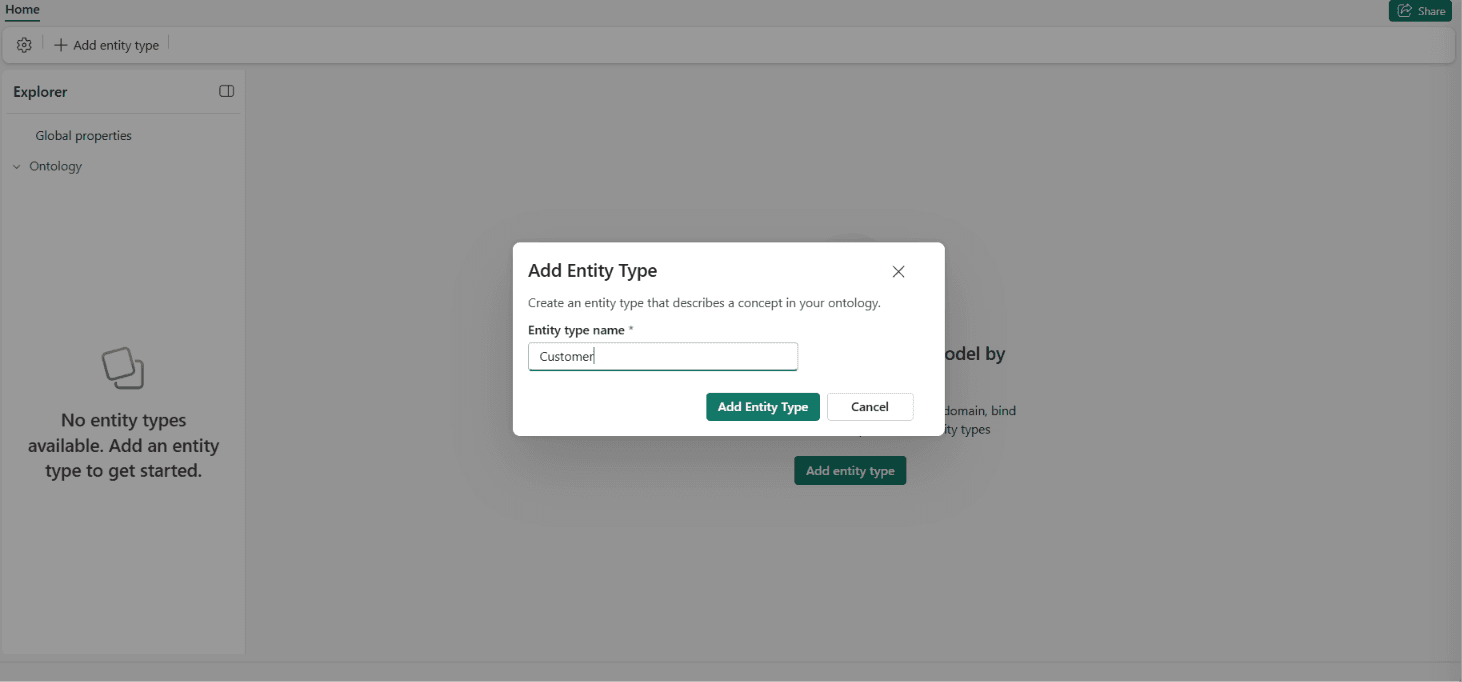
Notice the naming. The table is customers, lowercase and plural, because that's a file. The entity type is Customer, capitalised and singular, because that's a thing the business has. You'll be reading the second name for the rest of the project.
2.3 Give Customer its properties
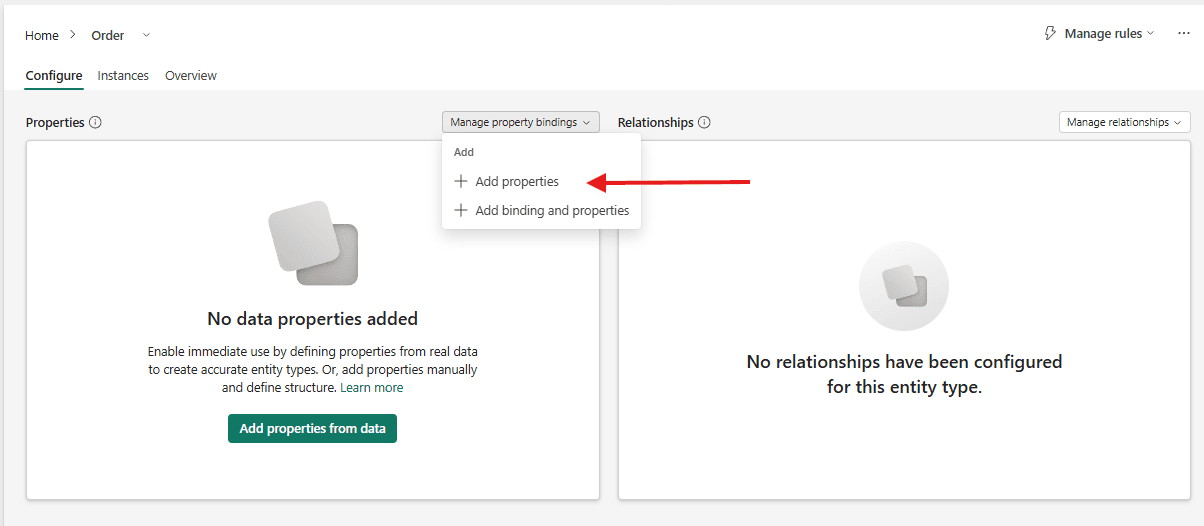
With Customer selected on the canvas, choose View Entity Type details in the ribbon. The entity type opens as a page with Configure, Instances and Overview tabs. On Configure, select Manage property bindings, then + Add properties.
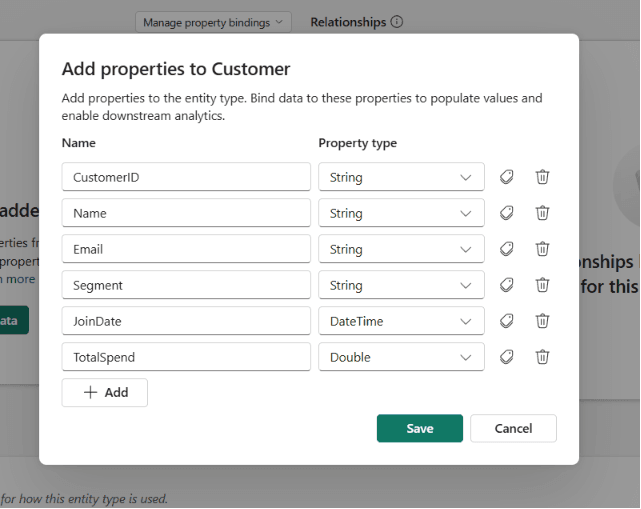
Add all six, setting the Property type on each:
| Property name | Property type |
|---|---|
| CustomerID | String |
| Name | String |
| String | |
| Segment | String |
| JoinDate | DateTime |
| TotalSpend | Double |
2.4 Define the key
Above the property list, select Define entity type key, then pick CustomerID.
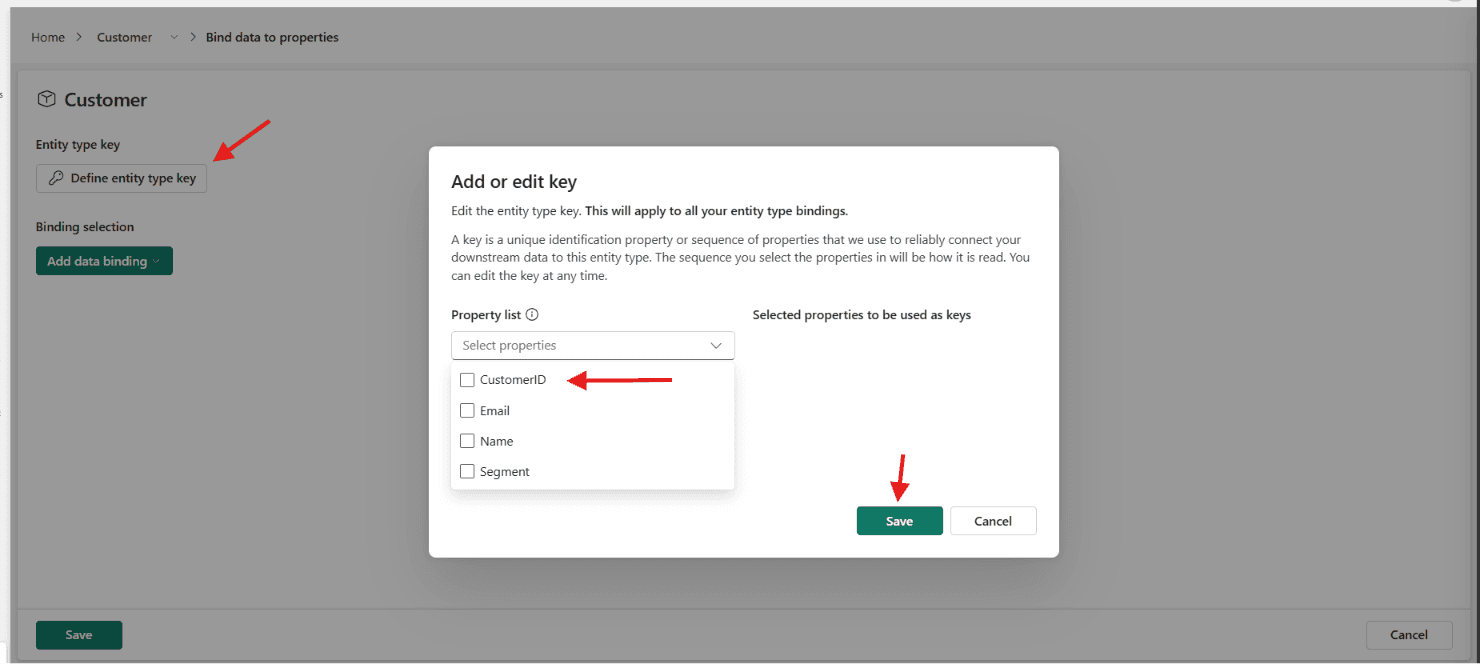
One more setting while you're here: Choose display name property, and pick Name. This is the label the graph shows for each customer. Skip it and instances read as C6 instead of Ravi Wang.
2.5 Repeat for the other seven
Same three steps for each entity type: properties, key, display name.
| Entity type | Key | Display name | Properties (type) |
|---|---|---|---|
| Customer | CustomerID | Name | CustomerID (String), Name (String), Email (String), Segment (String), JoinDate (DateTime), TotalSpend (Double) |
| Order | OrderID | OrderID | OrderID (String), Amount (Double), OrderDate (DateTime), DeliveryDate (DateTime), PaymentMethod (String) |
| OrderItem | OrderItemID | OrderItemID | OrderItemID (String), Quantity (Integer), UnitPrice (Double), LineTotal (Double) |
| Product | ProductID | Name | ProductID (String), Name (String), Price (Double), SKU (String), Rating (Double), StockLevel (Integer) |
| Seller | SellerID | Name | SellerID (String), Name (String), ResponseTimeHours (Integer), ReturnRatePct (Double) |
| Category | CategoryID | Name | CategoryID (String), Name (String), Description (String) |
| City | CityID | Name | CityID (String), Name (String), State (String), Country (String) |
| OrderStatus | OrderStatusID | StatusName | OrderStatusID (String), StatusName (String), IsTerminal (Boolean) |
OrderStatus is the one to get right. Its display name is StatusName, not OrderStatusID, so the graph later reads "Order O119 hasStatus Processing" instead of "hasStatus STAT1".
2.6 Say what it means (optional)
You can skip this and the ontology still works. But it is what teaches the agent to read your data in plain language later, so it is worth doing once you have all eight entity types in place.
On each entity type, scroll to Entity metadata and select Edit. There's a Description, and more interestingly, Synonyms.
Synonyms are how you tell an agent that "buyer", "client" and "shopper" all mean Customer. Fill them in:
| Entity type | Synonyms |
|---|---|
| Customer | buyer, client, shopper |
| Order | purchase |
| OrderItem | line item, order line |
| Product | item, SKU |
| Seller | vendor, merchant, store, shop |
| Category | department |
| City | location, region |
| OrderStatus | status, order state |
Properties have their own metadata too, behind the tag icon on each row. That's where business rules belong, and two of them carry the entire payoff of this article:
- On
Order.DeliveryDate: "Empty for Processing, Shipped and Cancelled orders alike, so an empty value does not mean someone is waiting." - On
OrderStatus.IsTerminal: "True for Delivered, Returned and Cancelled. Processing and Shipped are still open."
Read those two sentences again. That's the rule the ops lead needs, the one that was living in somebody's head when this article started. It's now written where the platform can read it.
Notice what you have not done yet. Eight entity types, every property typed, every key defined, and not one of them is connected to a single row of data. The model describes the business. It doesn't touch the lakehouse until Part 4.
Part 3: create relationships
Eight entity types, sitting on a canvas, none of them touching. This is the part that makes it an ontology rather than a glossary.
3.1 Add a relationship
In the ribbon, select + Add relationship.
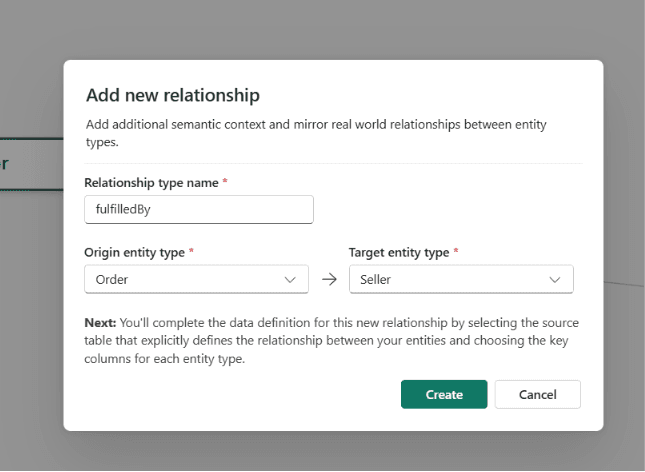
Three fields: Relationship type name, Origin entity type, Target entity type. Name it, pick both ends, select Create.
Read the dialog's own footnote while you're there: "Next: you'll complete the data definition for this new relationship by selecting the source table..." Creating a relationship doesn't bind anything. You're declaring that orders are placed by customers. Proving it comes in Part 5.
3.2 Create all eleven
Repeat that for every row in the table:
| # | Relationship type name | Origin | Target |
|---|---|---|---|
| 1 | placedBy | Order | Customer |
| 2 | fulfilledBy | Order | Seller |
| 3 | hasStatus | Order | OrderStatus |
| 4 | partOf | OrderItem | Order |
| 5 | refersTo | OrderItem | Product |
| 6 | belongsTo | Product | Category |
| 7 | soldBy | Product | Seller |
| 8 | prefers | Customer | Category |
| 9 | locatedIn | Customer | City |
| 10 | specializesIn | Seller | Category |
| 11 | basedIn | Seller | City |
Stand back and look at the canvas once they're drawn. Four of the eleven touch Order: placedBy, fulfilledBy, hasStatus, and partOf arriving from OrderItem. Order is the hub, which is exactly why the desk question has to route through it.
Look at what's not there too. There's no Order to Product relationship. To find out what's in an order you go Order, then its line items, then their products. That extra hop is the reason OrderItem exists: it carries the quantity and the price paid, which a direct link could never hold.
Part 4: bind entity types to data
Everything so far has been vocabulary. Not one entity type has seen a row.
4.1 Bind Customer to its table
Open Customer again (select it on the canvas, then View Entity Type details). Select Manage property bindings, then + Add binding and properties. You land on a Bind data to properties page with the entity key at the top and a Binding selection below it. Select Add data binding, then Lakehouse table.
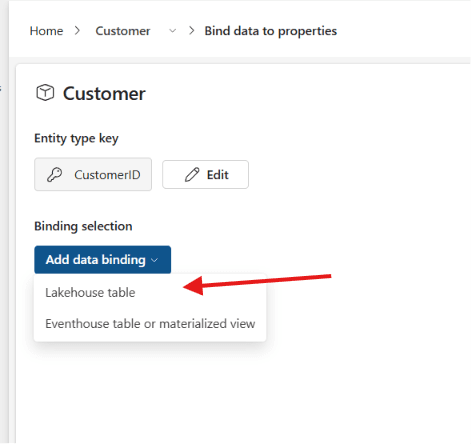
A OneLake catalog opens. Pick CityCartLH, then Tables → dbo → customers.
4.2 Check the mapping and save
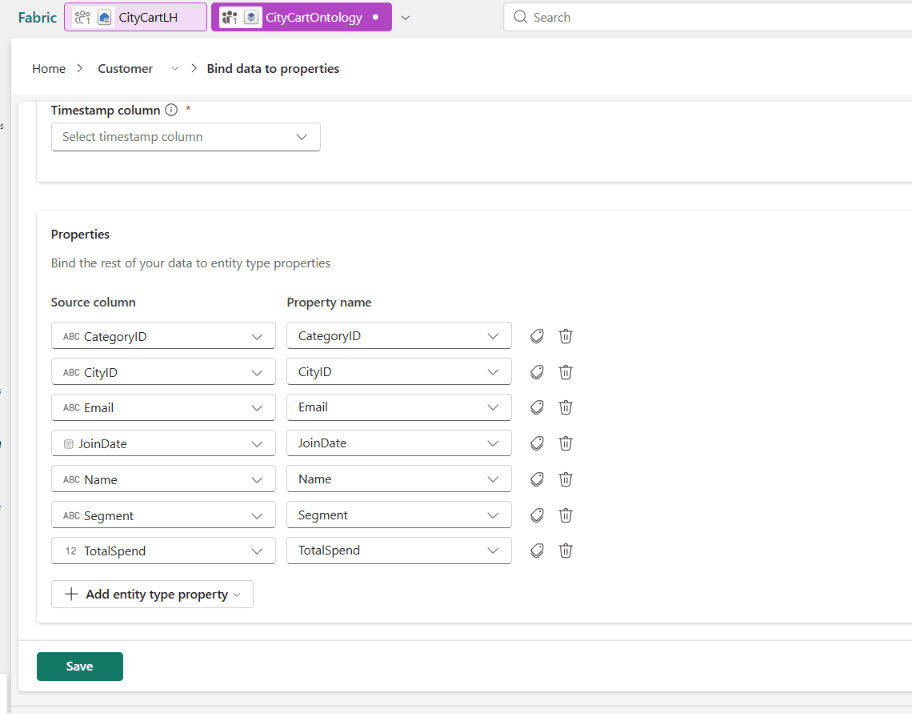
Fabric matches the source columns to your property names automatically. Review the mapping, then select Save. The key isn't in this list; it binds separately, at the top of the page.
4.3 Bind the remaining seven
Bind each one the same way:
| Entity type | Lakehouse table |
|---|---|
| Customer | customers |
| Order | orders |
| OrderItem | order_items |
| Product | products |
| Seller | sellers |
| Category | categories |
| City | cities |
| OrderStatus | order_status |
Part 5: configure relationships
Eleven relationships exist as claims. Now you show Fabric the data that backs each one.
5.1 Map the first relationship
Start with placedBy. Select its edge on the canvas to open it, and you get three panels. The origin on the left with its key and bound table, the target on the right with the same, and in the middle the thing you came for: Mapping table.
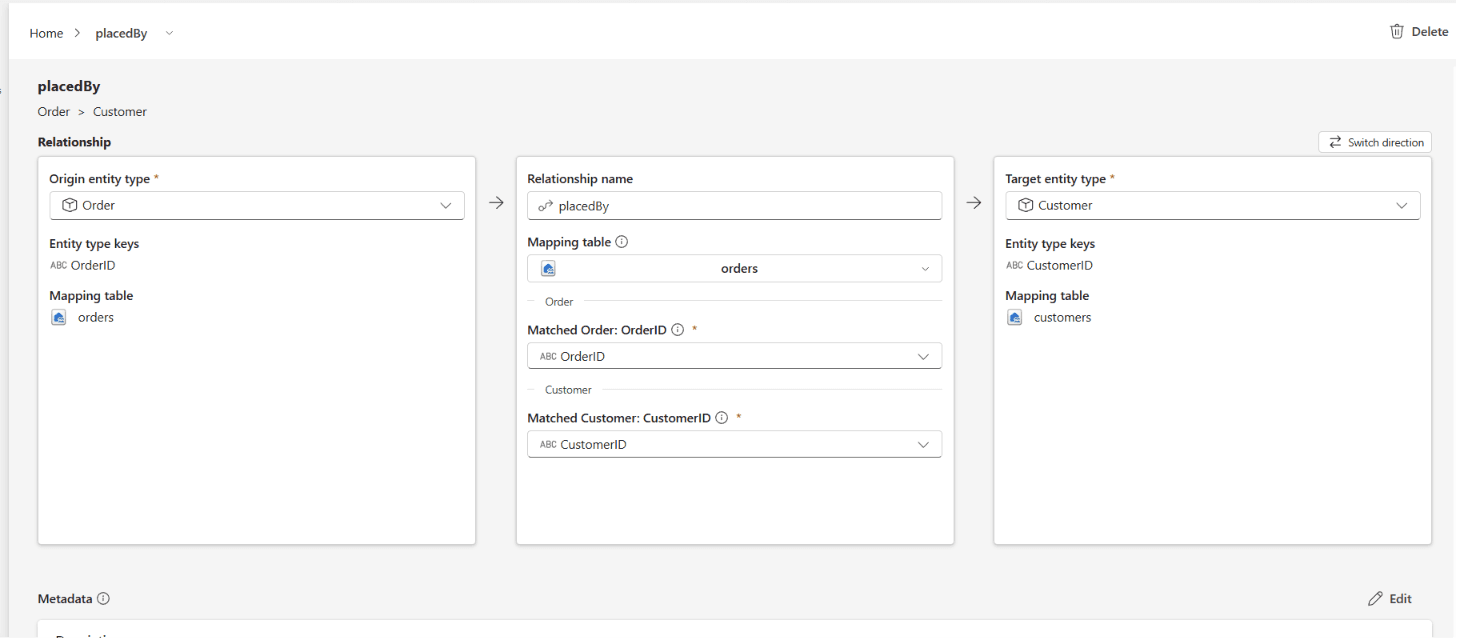
Under the picker sit two rows, one per side, reading Matched Order: OrderID and Matched Customer: CustomerID. Before you choose a table, both say Unbound.
Microsoft's tooltip on those rows says it better than I can: "select the column in the source data table that matches this entity key property."
That's the join, made explicit. A column in a table on one side. An entity key property on the other. They meet here and nowhere else.
For placedBy, choose orders. Both rows resolve immediately, because that one table holds OrderID and CustomerID side by side. Select Save.
5.2 Map the other ten
Here's the full reference. Open each relationship and confirm it matches this exactly:
| # | Relationship | Origin → Target | Mapping table | Matched (origin) | Matched (target) |
|---|---|---|---|---|---|
| 1 | placedBy | Order → Customer | orders | OrderID | CustomerID |
| 2 | fulfilledBy | Order → Seller | orders | OrderID | SellerID |
| 3 | hasStatus | Order → OrderStatus | orders | OrderID | OrderStatusID |
| 4 | partOf | OrderItem → Order | order_items | OrderItemID | OrderID |
| 5 | refersTo | OrderItem → Product | order_items | OrderItemID | ProductID |
| 6 | belongsTo | Product → Category | products | ProductID | CategoryID |
| 7 | soldBy | Product → Seller | products | ProductID | SellerID |
| 8 | prefers | Customer → Category | customers | CustomerID | CategoryID |
| 9 | locatedIn | Customer → City | customers | CustomerID | CityID |
| 10 | specializesIn | Seller → Category | sellers | SellerID | CategoryID |
| 11 | basedIn | Seller → City | sellers | SellerID | CityID |
That's all eleven relationships mapped. Each one is a join you would otherwise rewrite by hand every time you queried the data. Now the platform holds them, once and for all.
Part 6: verify the graph materialized
While you were saving bindings and mapping relationships, Fabric was already working behind the scenes: it materializes the ontology into a graph and loads every entity's rows into it. This takes a minute or two to settle. Now you check that it worked.
6.1 Open the graph
Go back to the workspace item list. Next to your ontology sits a new item it created for you: a graph model named CityCartOntology_graph_…. Open it.
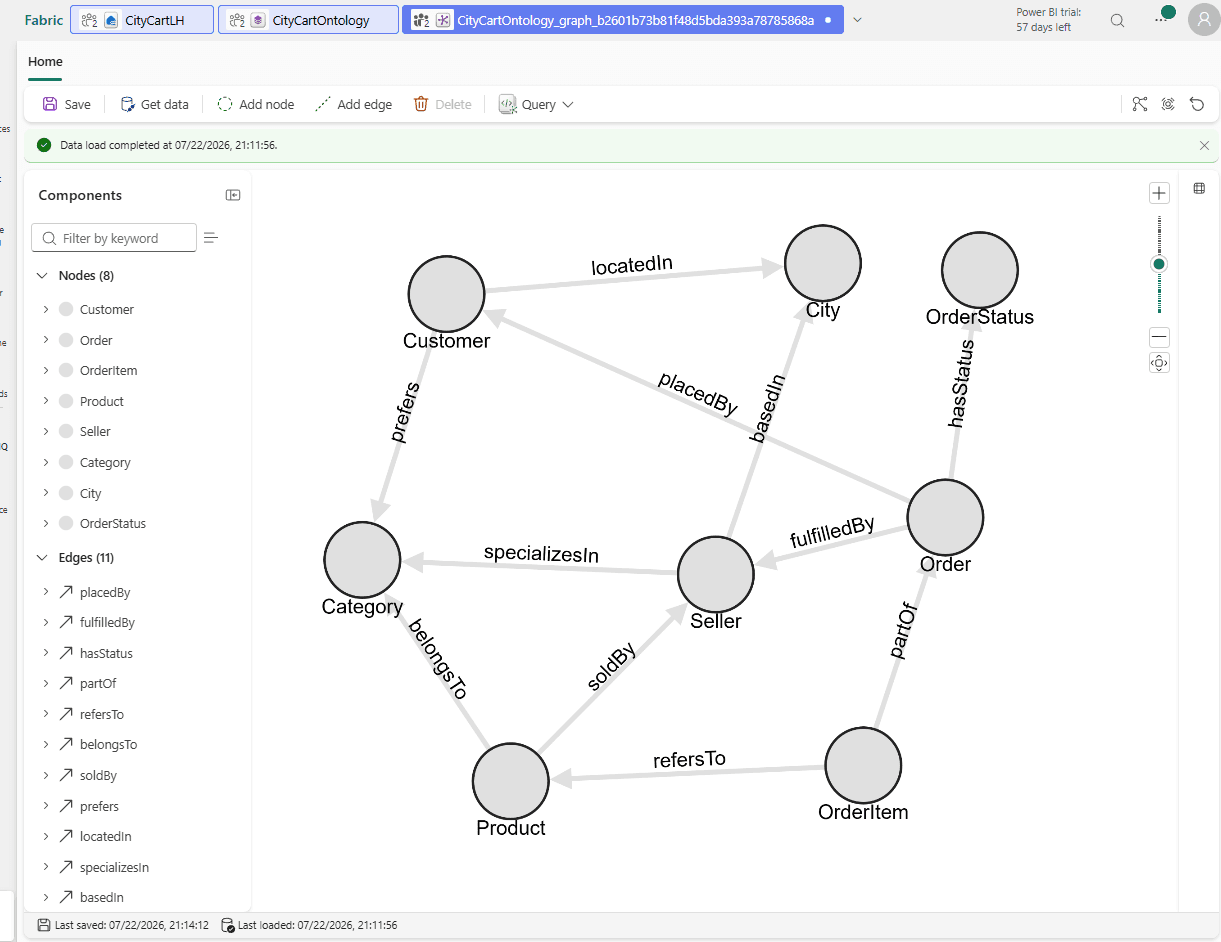
The canvas shows the whole model materialized: eight nodes, one per entity type, and eleven edges, one per relationship, each labelled with the name you gave it, placedBy, refersTo, belongsTo and the rest. The Components panel on the left counts them back to you: Nodes (8), Edges (11). A banner across the top reads Data load completed, with a timestamp. That's the confirmation you want. Fabric has read every bound table and loaded the rows into the graph, so OrderItem → refersTo → Product is no longer a claim in a designer, it's an edge with data behind it.
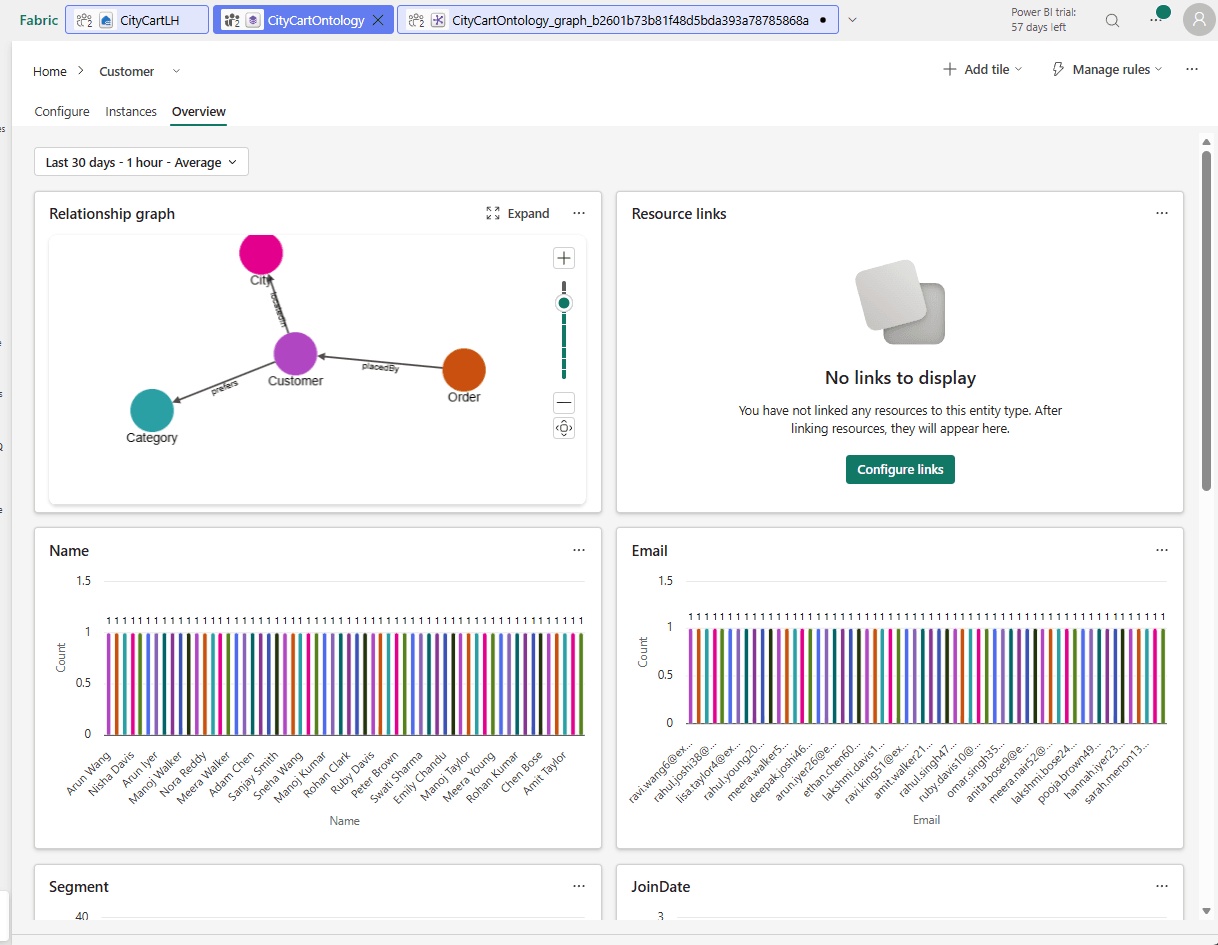
You can also confirm a single entity from its Overview tab. Open Customer, select Overview, and the Relationship graph card shows it wired to City, Order and Category, while the property cards below (Name, Email, Segment, JoinDate) chart the real rows: sixty customers, each name plotted once. That's the Part 4 binding working, entity by entity.
Part 7: ask the agent
This is what the whole build was for: a data agent that answers the opening question in plain English, grounded on the graph you just materialized.
7.1 Create the agent and point it at the ontology
In the workspace, select + New item, then Data agent. Name it CityCartDA.
In the agent, select Add data source. A OneLake catalog opens with four items that share the CityCart name. Pick the one whose type is Ontology, CityCartOntology.
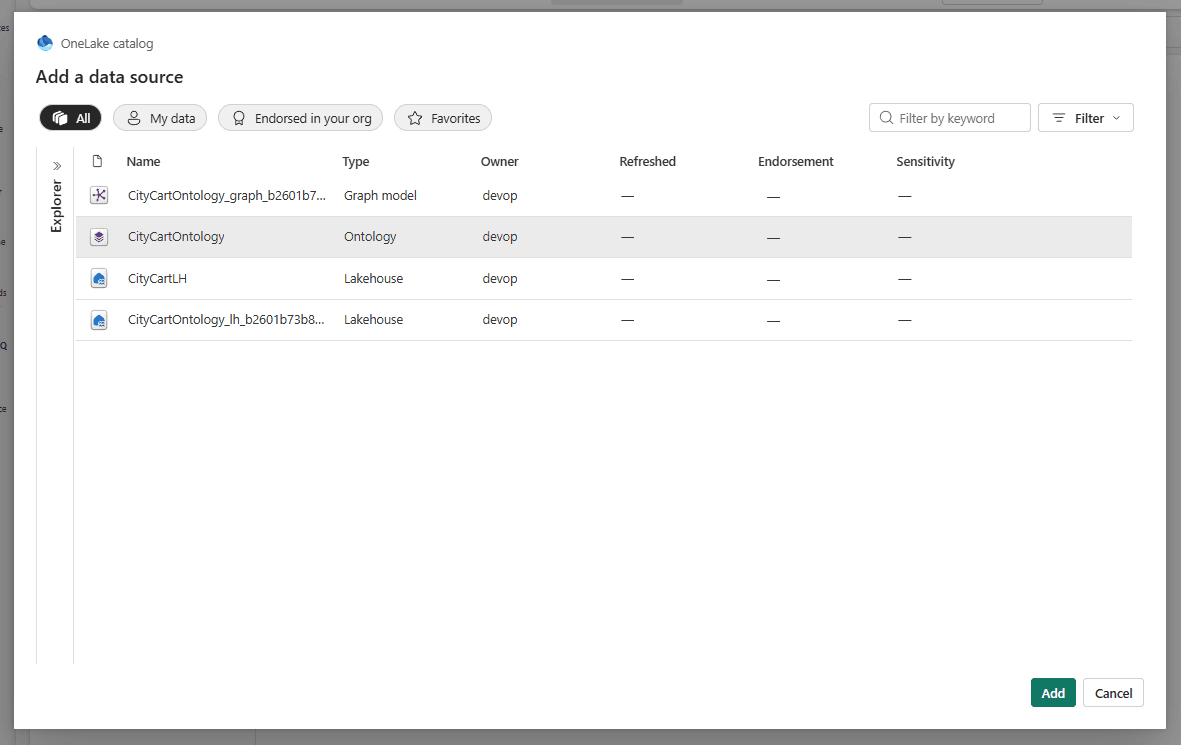
Not the two lakehouses, and not the raw graph model. CityCartLH is the tables with no meaning, the exact thing you're trying to beat. CityCartOntology_lh_… is the ontology's internal store. The Ontology is the one that carries the entity types, the relationships, and the synonyms.
7.2 Ask without instructions
Before you tell the agent anything, ask it the opening question:
The Standing Desk is out of stock. Who is blocked waiting on one, where are they, and which seller is meant to be shipping it?
It answers with confidence, and it looks right:
The following customers are currently blocked... Ravi Wang (Lucknow), Swati Sharma (Surat), Manoj Taylor (Ahmedabad)... the seller is Sunrise Traders.
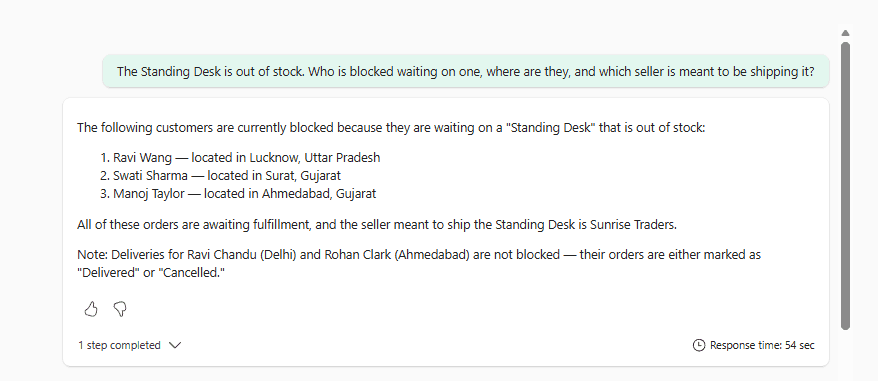
Look at how much it got right on its own. It walked the graph from the desk to its order lines to the orders to the people waiting, and it even threw out Ravi Chandu's delivered orders and Rohan Clark's cancelled one without being told.
But the answer is wrong. It says three. The truth is two. Swati Sharma's order is Shipped, which means her desk already left the warehouse and is in transit. She isn't blocked, and the unit she's getting was in stock when it went out. The agent had no way to know that. To it, an order that isn't delivered is an order still waiting, so it counted Shipped and Processing the same.
That's the escalation from the start of this article, happening in front of you. A raw "no delivery date" query returns four, including the cancelled desk. The agent was smarter than that and got to three. But three still counts the shipped one. Only the business meaning of the word "blocked" gets you to two, and no column carries it.
7.3 Give it the meaning
Select Agent instructions and write down what no column says. The part that matters most is the order status:
Processing means the order is open and the customer is still waiting. Shipped means it has left the warehouse and is in transit, so that customer is not blocked. Cancelled orders are waiting on nothing. "Blocked" and "waiting" mean Processing.
Add the terminology alongside it, so the agent knows a buyer is a Customer, and how to walk from a product to the people waiting on it: start at the Product, follow its order lines to their Orders, keep the ones that are Processing, and read off the Customer, City and Seller.
7.4 Ask again
Same question, same data, same graph. This time:
The following customers are currently blocked and waiting for a Standing Desk:
- Ravi Wang (Lucknow)
- Manoj Taylor (Ahmedabad)
The seller meant to ship it is Sunrise Traders.
Note: Swati Sharma has an order marked as "Shipped" (not blocked), and other customers either had their orders delivered or cancelled, so they are not waiting.
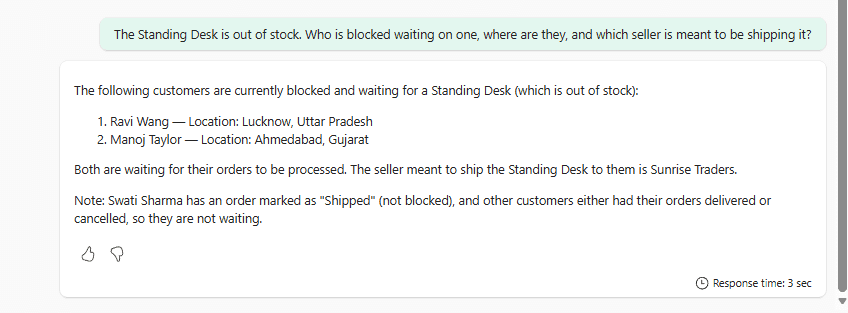
Read that note the agent added on its own. Swati Sharma is gone. Her order is Shipped, and you've now told the agent that Shipped means in transit, not waiting. Three became two, and the one that dropped is the one order the business would never have called blocked. Ask "how many customers" and it says two, because it's counting the graph against a rule now, not guessing.
That's the whole article in one before and after. The join was never the hard part. Knowing that Shipped means in transit is, and no column carries it. You wrote it into the ontology, and the agent could finally read it.