fabric-iq
Episode 1: Build a retail ontology in Microsoft Fabric, step by step
Hands-on lab: set up a Fabric workspace, load 17 CSVs into a lakehouse and build a 15-entity ontology and graph by hand, then preview an AI agent answering from it.
Part of the series Yuktikara Store: Microsoft Fabric, End to End · Episode 1 of 6
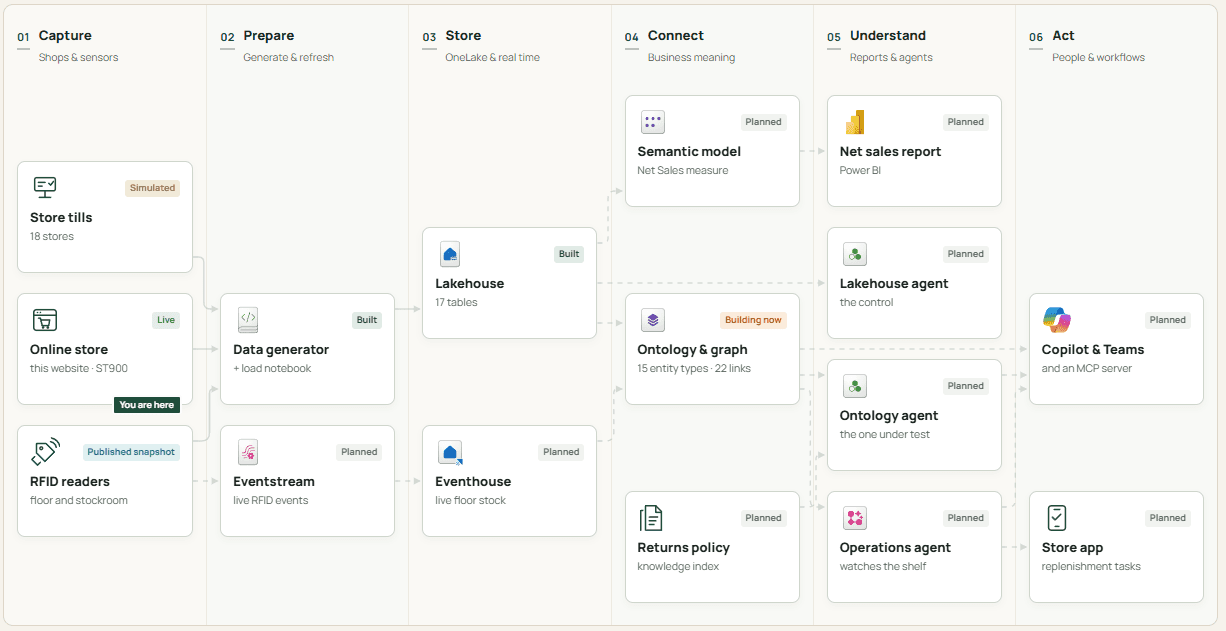
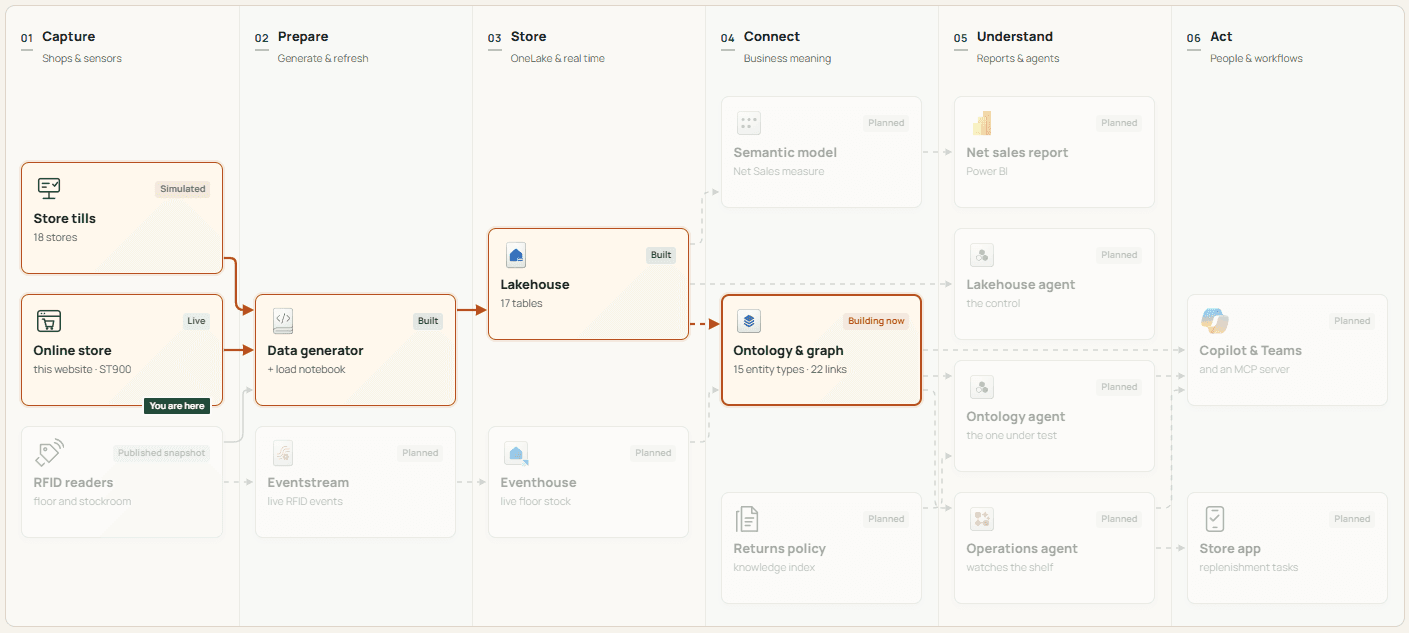
We're building an end-to-end Microsoft Fabric solution for Yuktikara Store, a fictional outdoor retailer, one episode at a time: a lakehouse, an ontology, AI agents, a live RFID feed, an operations agent and a store app. This is a hands-on lab. Follow each step in your own Fabric tenant and you'll end up with the same platform.
Episode 1 is the foundation: workspace → lakehouse → data → ontology → graph, set up so every later episode builds on it. Everything is built by hand in the portal. The only code is one notebook that loads the files.
Everything you need is in the repo: github.com/RaviChanduEdru/Yuktikara_Store. Nothing here is a real company.
Before you start
- A Fabric trial capacity is enough. Everything in this episode runs on it. You'll move to a paid F2 in Episode 2, because data agents don't run on a trial.
- Check your region supports Graph. Admin portal → Capacity settings → your capacity → note the region. Central India, East US, West Europe and UK South all work. Everything in the series stays in this one region.
- Turn on two tenant settings (Admin portal → Tenant settings): Ontology item (preview) and Graph.
You'll download two things from GitHub along the way: the data in Step 5 and a notebook in Step 6.
Step 1: Create the workspace
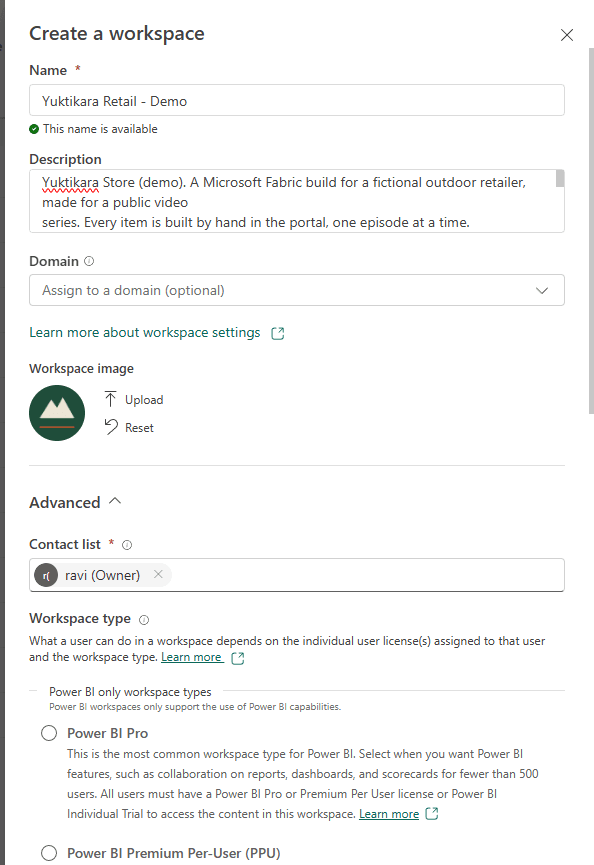
Workspaces → + New workspace.
| Field | Value |
|---|---|
| Name | Yuktikara Retail - Demo |
| Description | Yuktikara Store (demo). A Microsoft Fabric build for a fictional outdoor retailer, made for a public video series, built by hand in the portal, one episode at a time. All data is synthetic. |
| Workspace image | Optional. The repo has one: docs/assets/workspace-image.png |
| Advanced → Contact list | Leave it as you |
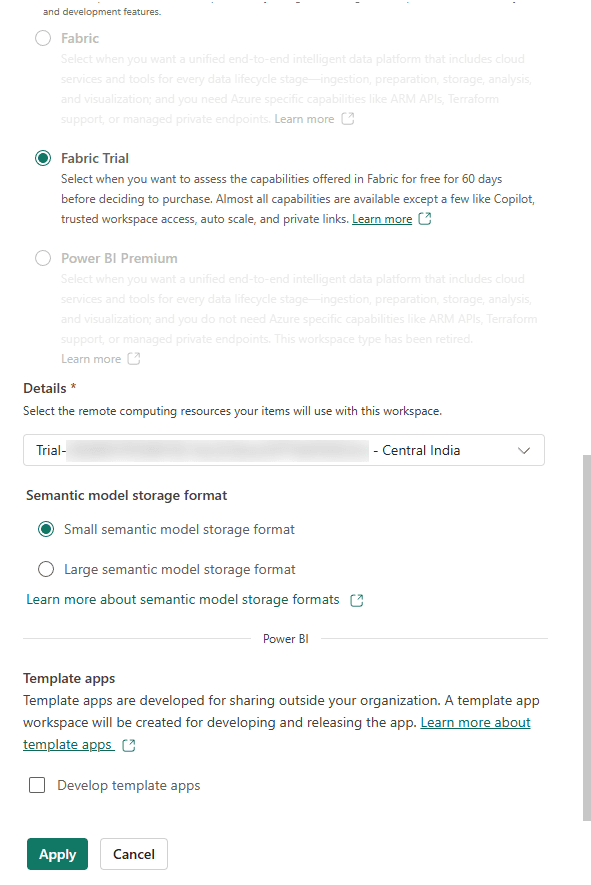
| Advanced → Workspace type | Fabric Trial |
| Advanced → Details | Your trial capacity |

"- Demo" in the name tells anyone scanning the workspace list that this isn't production.
Step 2: Create four folders
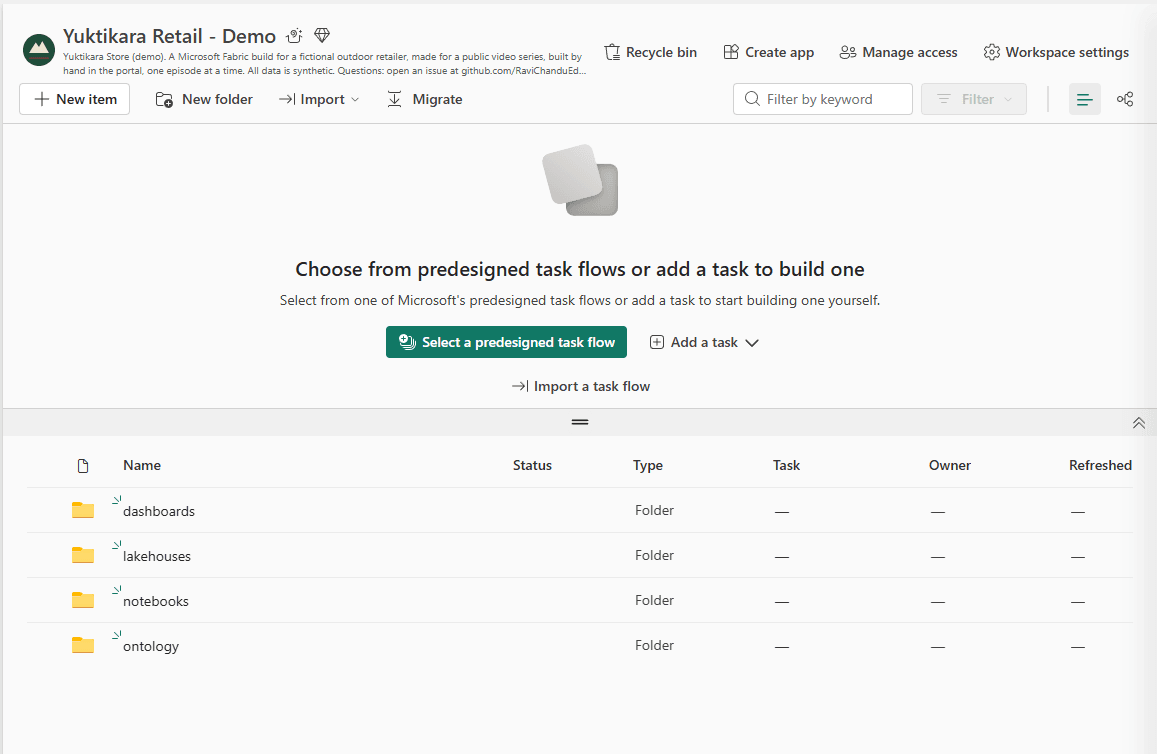
In the workspace: New folder, four times.
| Folder | What goes in it |
|---|---|
lakehouses | yuktikara_lh |
notebooks | load_yuktikara_data |
dashboards | Empty for now. The semantic model arrives in Episode 2 |
ontology | Yuktikara_Ontology and the three items Fabric creates with it |
When you create an item, choose its folder under Location in the create dialog (Steps 4 and 9 show it). Anything that lands in the workspace root can be moved with … → Move to.
dashboards is created now so the workspace is ready for Episode 2. The folders for agents, real-time data and the app come in their own episodes.
Step 3: Set up the task flow
The task flow is the diagram at the top of the workspace. Folders say what an item is; the task flow says what it's for. Click a task and the item list filters to it.
In the empty task flow area, open Add a task and add four tasks of these types:
| Task type | Rename it to |
|---|---|
| Get data | Load data |
| Store data | Lakehouse |
| Visualize data | Sales model |
| General | Ontology |
Sales model stays empty until Episode 2.
Connect them by dragging from one task's edge to the next: Get data → Store, Store → Visualize, Store → General. Connect as you go; an unconnected task jumps back to its default spot when you add the next one.
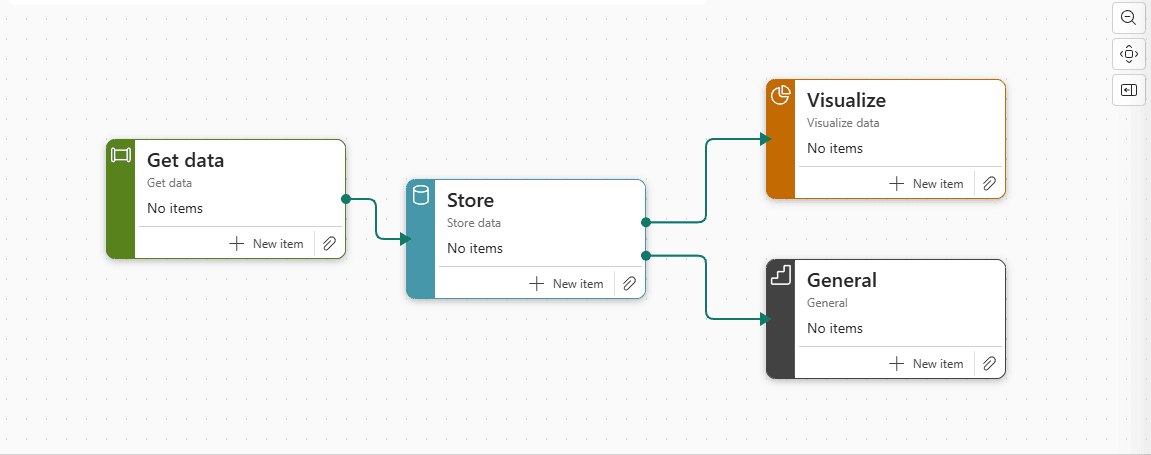
Now rename each one: select the task → Edit → name from the table above → Save.
Then name the flow itself Yuktikara Store platform, from the name menu at the top left of the canvas.
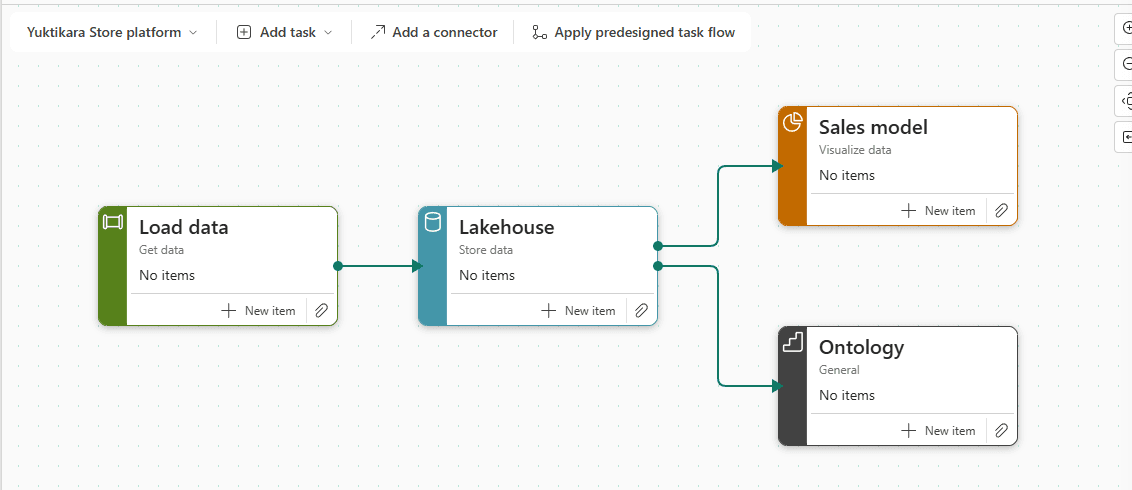
From here on, assign each item to its task the moment you create it. The easiest way: create it from the task's + New item, and the dialog fills in the task for you. For an item that already exists, use the task's clip icon → Assign item.
Step 4: Create the lakehouse
On the Lakehouse task, select + New item → Lakehouse.
| Field | Value |
|---|---|
| Name | yuktikara_lh |
| Location | Yuktikara Retail - Demo > lakehouses |
| Assign to task | Lakehouse |
| Lakehouse schemas | On |
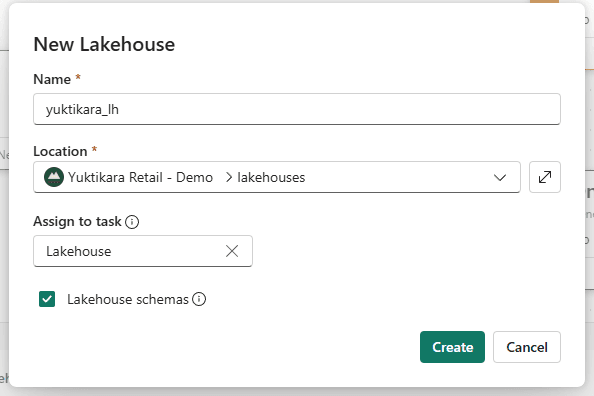
Don't turn on OneLake security for this lakehouse later. An ontology can't bind to a lakehouse that has it.
Step 5: Upload the data
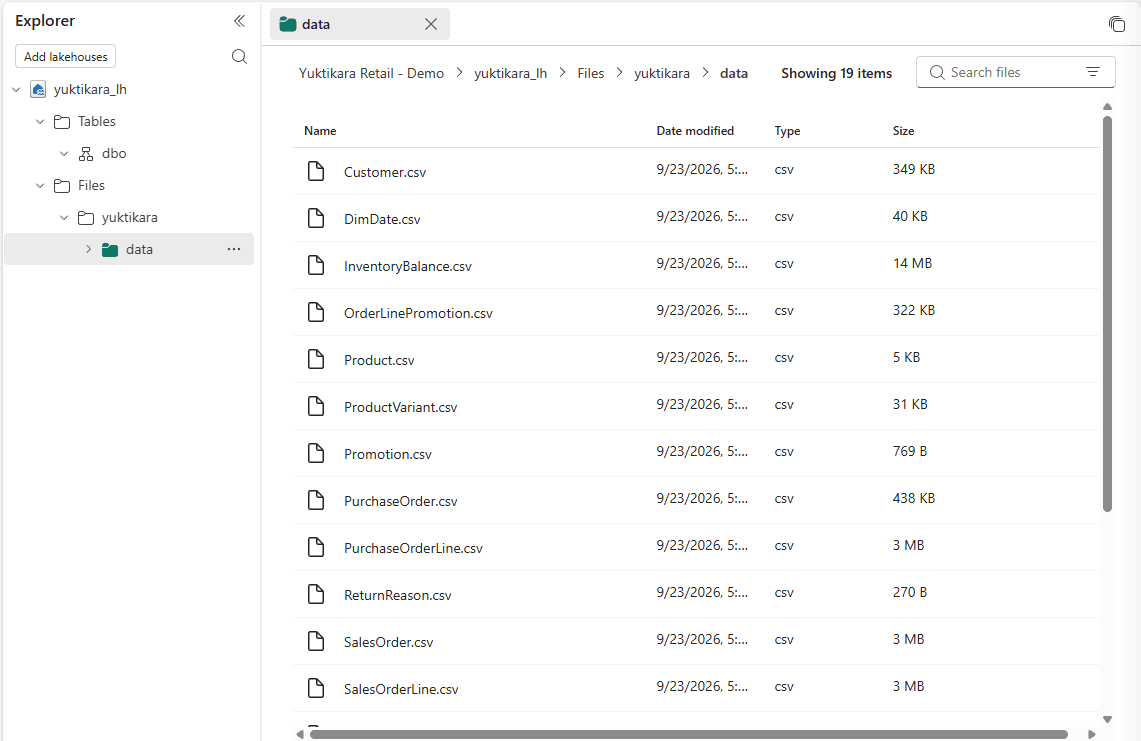
Download it. yuktikara-store-data.zip (4 MB), then unzip it. You get a data folder: 17 CSVs and two JSON files.
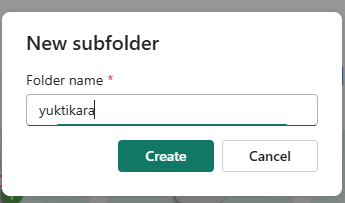
Upload it. In the lakehouse, under Files: … → New subfolder → yuktikara → Create.
Open yuktikara, then Upload → Upload folder and pick the data folder you just unzipped.
You should see Files/yuktikara/data/ holding 17 CSVs, manifest.json (row counts and checksums) and expected_answers.json (the answer key).
Never load the answer key into a table. In Episode 2 an agent pointed at the lakehouse could find it.
Step 6: Load the tables
Download it. load_yuktikara_data.ipynb.
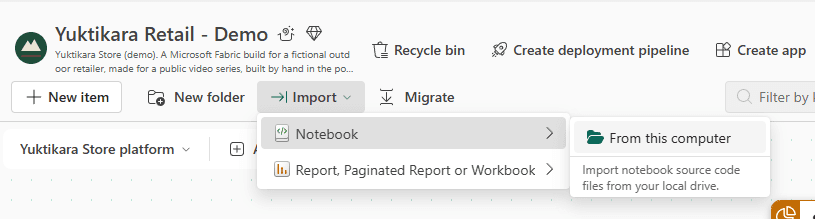
Import it. Open the notebooks folder, then Import → Notebook → From this computer → pick the file you downloaded.
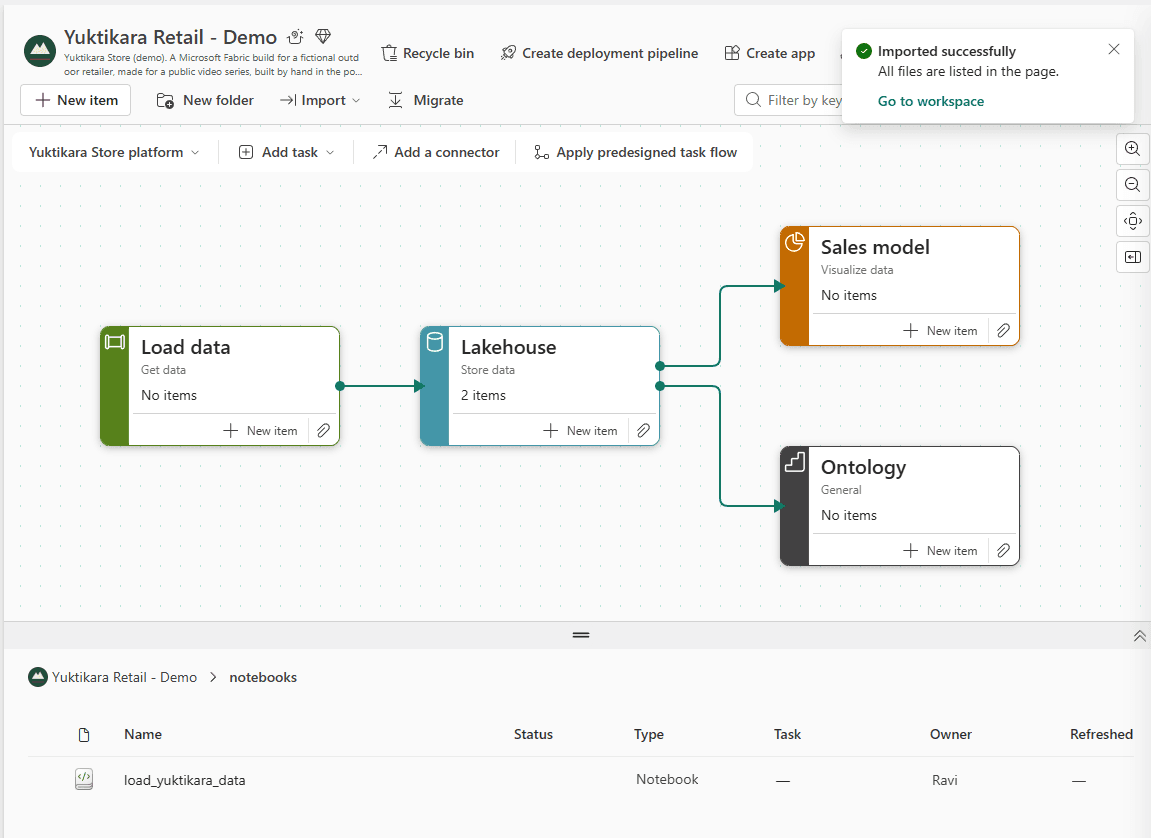
Assign it. Import doesn't ask for a task, so the notebook arrives unassigned. On the Load data task: clip icon → Assign item → load_yuktikara_data → Select.
Run it. Open the notebook:
- Explorer → Data items → Add data items →
yuktikara_lh. The pin next to it means it's the default lakehouse, which is where the notebook reads and writes. - Run all.
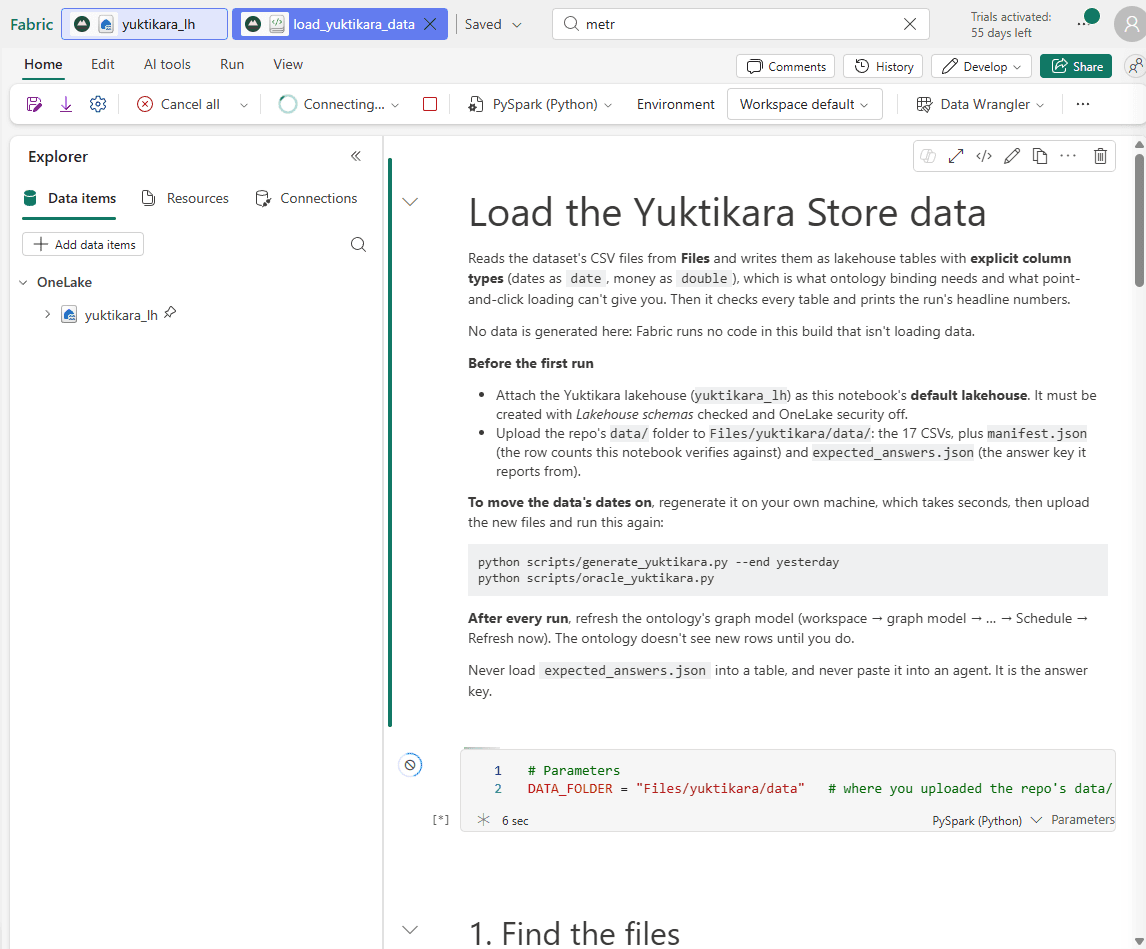
The notebook reads each CSV with explicit column types (dates as date, money as double) and writes a Delta table. Clicking Load to table on a CSV can't set types, and the ontology needs them.
Check the 3. Verify cell (about a minute): 17 lines, every one PASS, ending with PASS: 17 tables, row counts match the manifest, dates are date, money is double, no column mapping. If anything says FAIL, the cell stops and tells you which table and why.
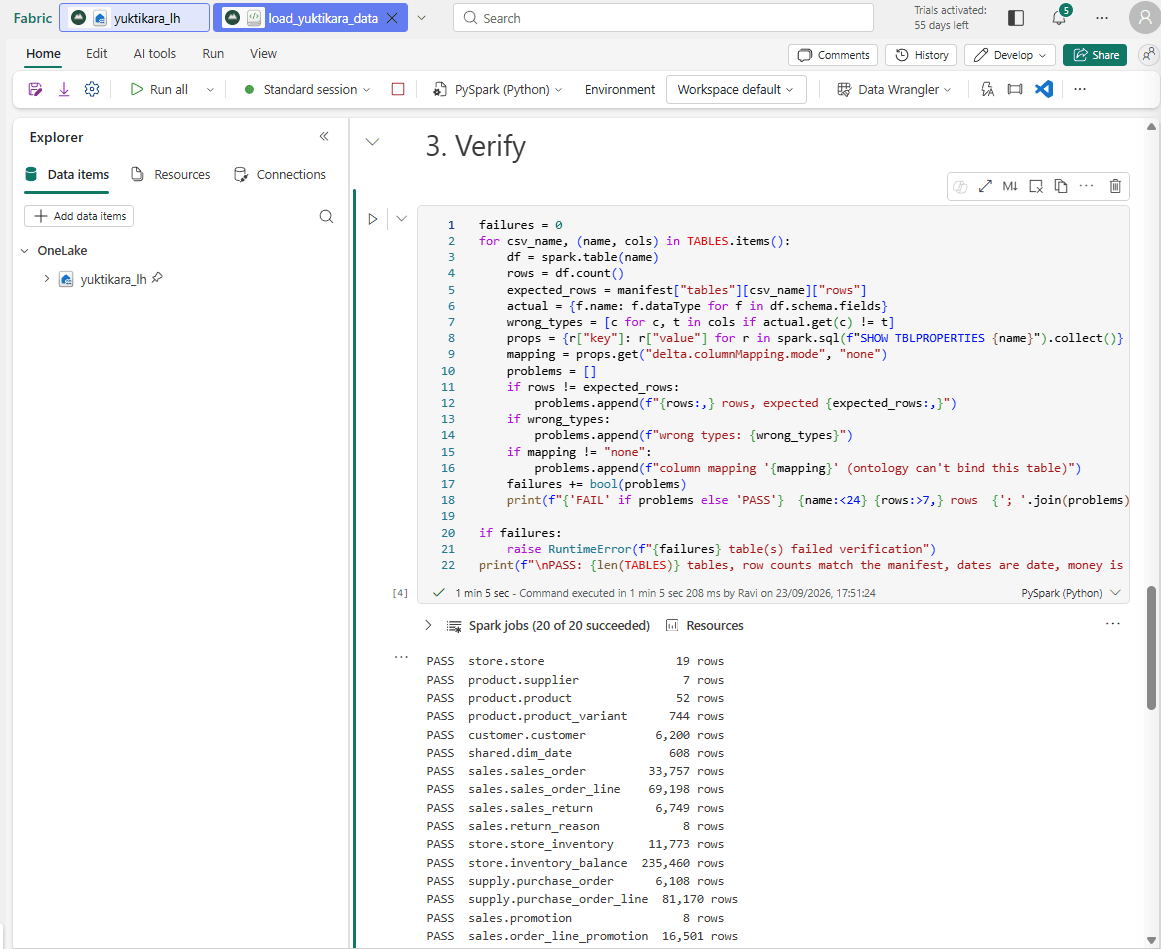
The tables land in six schemas, one per business area:
| Schema | Tables |
|---|---|
sales | orders, order lines, returns, return reasons, promotions, targets |
product | products, variants, suppliers |
store | stores, current stock, monthly stock history |
supply | purchase orders and their lines |
customer | customers |
shared | dim_date |
Don't see them in the lakehouse? The explorer doesn't update by itself: Tables → … → Refresh.
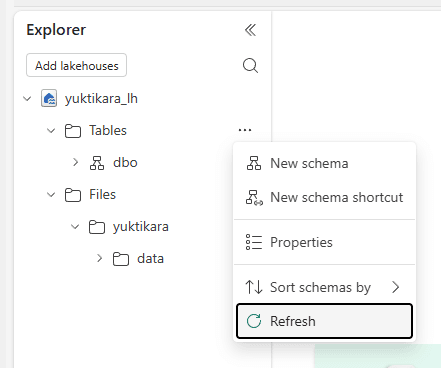
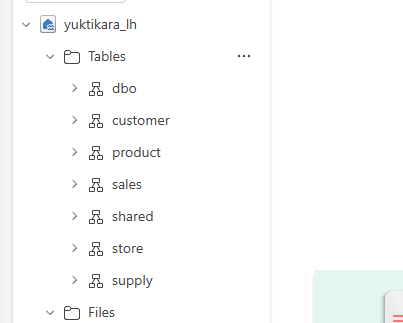
The default dbo schema stays empty. Column-by-column detail is in the data model.
Step 7 (optional): Query it with SQL
Every lakehouse comes with a SQL analytics endpoint: read-only T-SQL over the same tables, with nothing copied. It's the second item on the Lakehouse task.
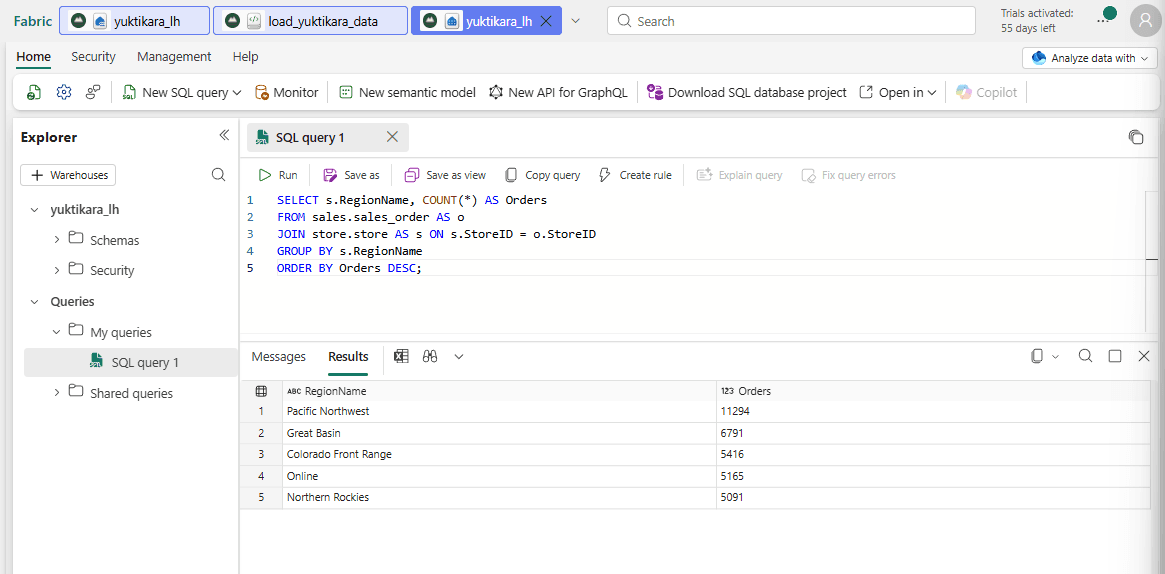
In the workspace, open the yuktikara_lh item whose type is SQL analytics endpoint → New SQL query → paste → Run:
SELECT s.RegionName, COUNT(*) AS Orders
FROM sales.sales_order AS o
JOIN store.store AS s ON s.StoreID = o.StoreID
GROUP BY s.RegionName
ORDER BY Orders DESC;
You should get five rows, 33,757 orders in total:
| RegionName | Orders |
|---|---|
| Pacific Northwest | 11,294 |
| Great Basin | 6,791 |
| Colorado Front Range | 5,416 |
| Online | 5,165 |
| Northern Rockies | 5,091 |
The join crosses two schemas, sales and store, written as schema.table like in any SQL database.
What about "what were our sales last quarter"? In this data that question has more than one plausible answer. Sorting it out is where Episode 2 starts.
Step 8: Three ontology rules to know first
The ontology describes the business as entity types (Store, SalesOrder, Supplier…) and relationships between them. Three rules shape how Yuktikara's is built:
- Some names are reserved.
PRODUCT,ORDERandRETURNare reserved words in GQL, the graph's query language. So the entity types areProductStyle,SalesOrderandSalesReturn. - Property names are unique across the whole ontology, not just within one entity type.
StoreIDstays only onStore. Everywhere else it takes a prefix:OrderStoreID,BalanceStoreID. That's 29 renames in total. - Every entity type needs a single-column key. Order lines and stock rows are normally identified by two or three columns, so the data carries one-column keys for them:
OrderLineID,InventoryID,BalanceID.
Two tables don't become entity types: dim_date (dates are properties on the things that happen) and order_line_promotion (it only links lines to promotions).
Step 9: Create the ontology and its entity types
On the Ontology task, select + New item → Ontology (preview).
| Field | Value |
|---|---|
| Name | Yuktikara_Ontology (letters, numbers and underscores only) |
| Location | Yuktikara Retail - Demo > ontology |
| Assign to task | Ontology |
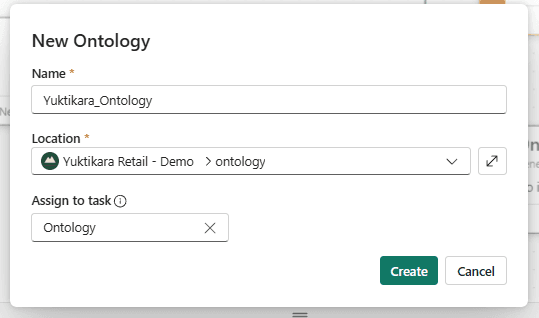
Fabric also creates three items that belong to the ontology: a graph model, a lakehouse named Yuktikara_Ontology_lh_… and its SQL analytics endpoint. They land in ontology, under the Ontology task. Leave them alone; you only touch the graph model, in Step 11.
Build all 15 entity types before any relationship. A relationship needs a key at both ends.
Your first entity type, start to finish: Store
Store is the simplest: 10 columns, no renames. It's worked through in full here; the other 14 follow the same steps.
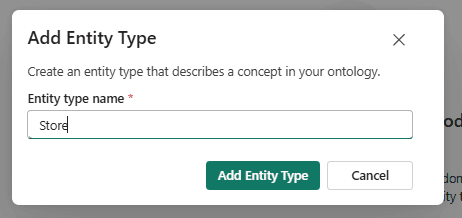
1. Create the entity type. On the canvas, select Add entity type (top ribbon, or the middle of the empty canvas). Name it Store → Add Entity Type.
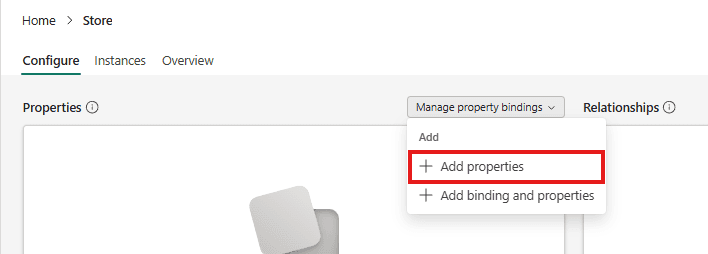
2. Add its properties. Select Store in the Explorer → View entity type details. On the Configure page: Manage property bindings → Add properties.
Add one row per column, with its type, then Save:
| Name | Property type |
|---|---|
StoreID | String |
StoreName | String |
RegionName | String |
City | String |
StateCode | String |
Latitude | Double |
Longitude | Double |
StoreFormat | String |
SquareFeet | Integer |
OpenedDate | DateTime |
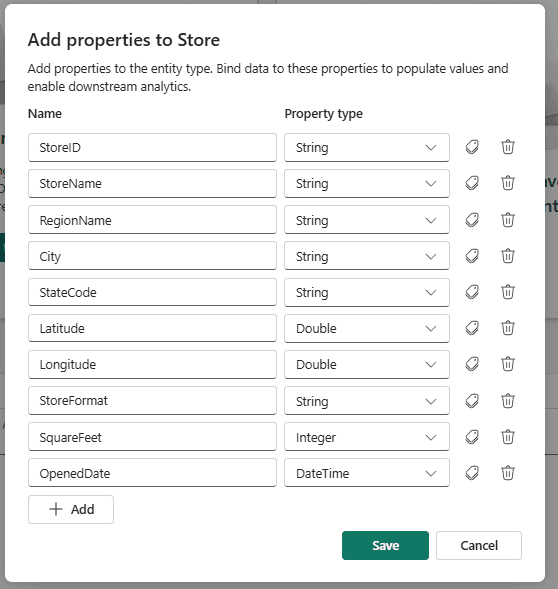
The properties now exist but hold no data yet: the Configure page lists them as Unbound.
3. Set the key. Still on Configure: Define entity type key → StoreID → Save. The key is what makes each store one instance.
4. Bind the table. Manage property bindings → Add binding and properties → Add data binding → in the OneLake catalog: yuktikara_lh → Tables → store → store.
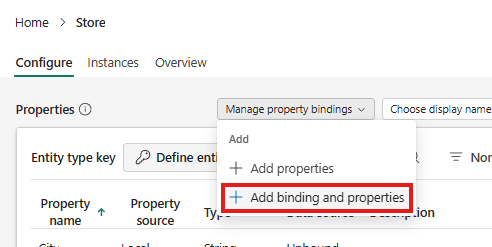
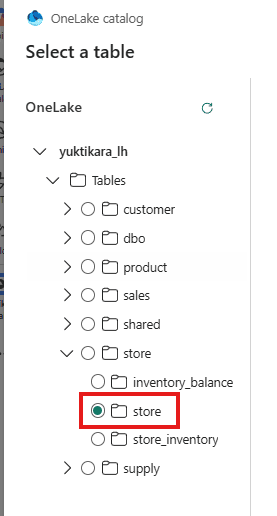
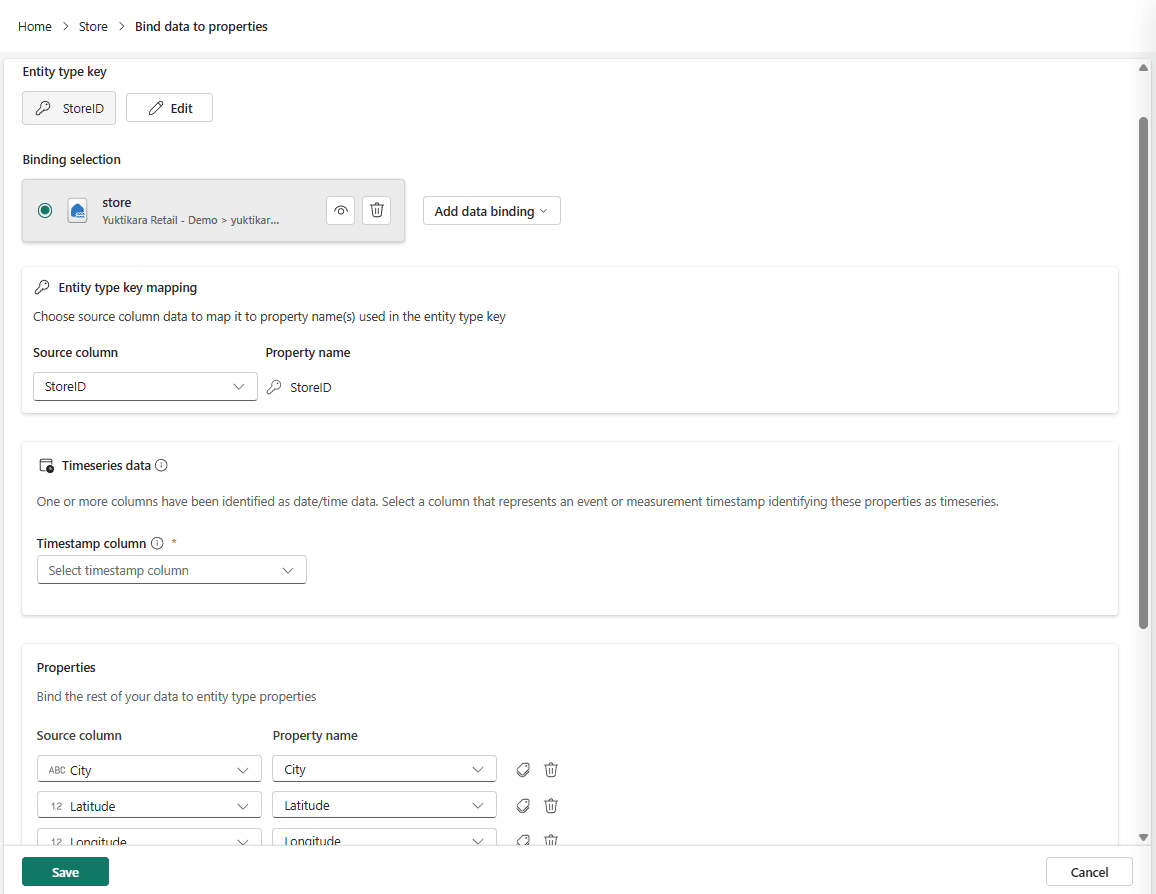
The Bind data to properties page opens:
- Entity type key:
StoreID, from step 3. - Entity type key mapping: source column
StoreID→ propertyStoreID. - Properties: each Source column on the left, the property you created on the right, for every column except the key. Where a name doesn't match up by itself, pick it from the dropdown. There's no type to set here; the icon before each column (ABC, 1.2, 123, a calendar) shows the type it brings with it.
- Timeseries data: leave Timestamp column empty. It shows up because
OpenedDateis a date, but Store isn't a time series. Time series arrive with the RFID feed in Episode 3.
Save, wait for entity type updated successfully, then Cancel back to Configure.
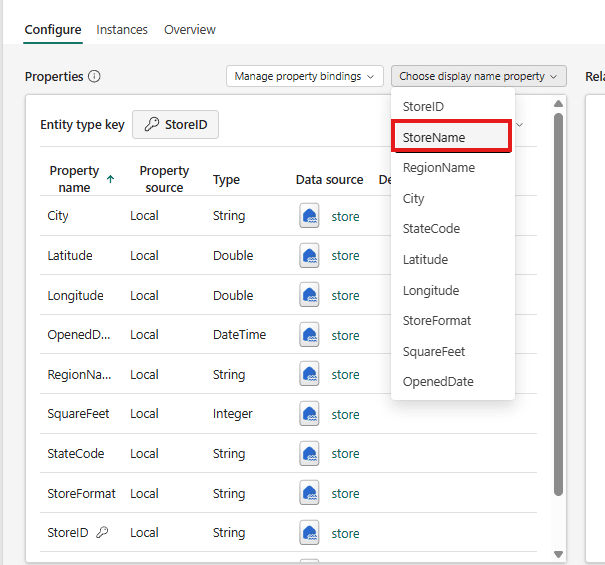
5. Set the display name. On Configure, check every property now shows store under Data source, then Choose display name property → StoreName. The graph now shows Yuktikara Seattle Flagship instead of ST001.
Shortcut for the other 14: skip step 2. Add binding and properties on its own creates the properties straight from the table's columns, and you rename only the few that need it.
The other 14
The same steps for each (with the shortcut: create, bind, key, display name), in this order:
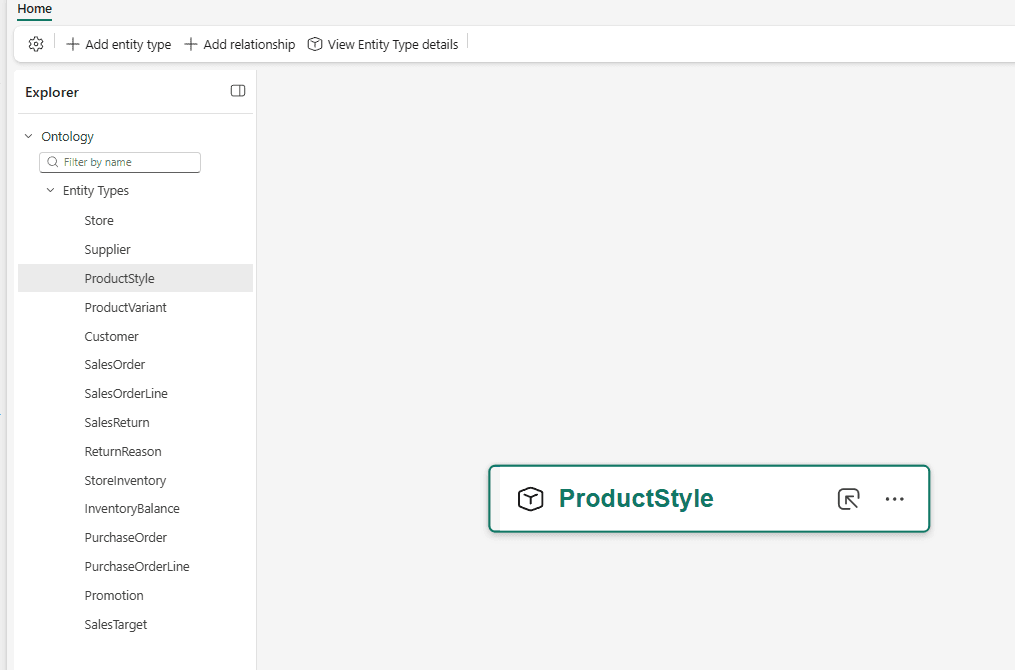
Supplier, ProductStyle, ProductVariant, Customer, SalesOrder, SalesOrderLine, SalesReturn, ReturnReason, StoreInventory, InventoryBalance, PurchaseOrder, PurchaseOrderLine, Promotion, SalesTarget.
Most need a few property renames (rule 2). Don't guess them.
Checkpoint: 15 entity types in the Explorer, each with a key, a display name and every property bound.
Step 10: Add the relationships
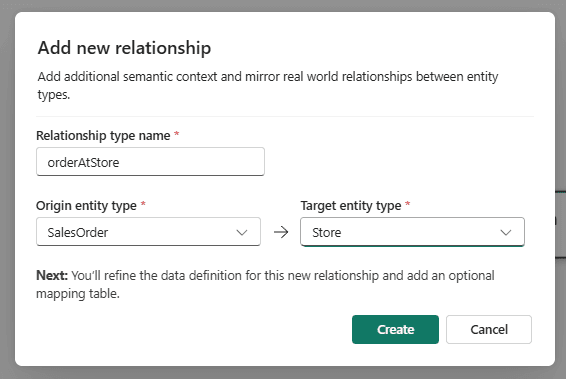
Here's the first one, orderAtStore (which store took this order):
1. Create it. On the Home toolbar: + Add relationship.
| Field | Value |
|---|---|
| Relationship type name | orderAtStore |
| Origin entity type | SalesOrder |
| Target entity type | Store |
Create.
2. Give it data. Select the new relationship on the canvas. The page has three panels: origin, relationship, target. In the middle one:
- Mapping table:
sales_order, the table that holds both an order and its store. - Matched SalesOrder: OrderID: the column that matches SalesOrder's key,
OrderID. - Matched Store: StoreID: the column that matches Store's key,
StoreID.
Save, then Cancel to close it.
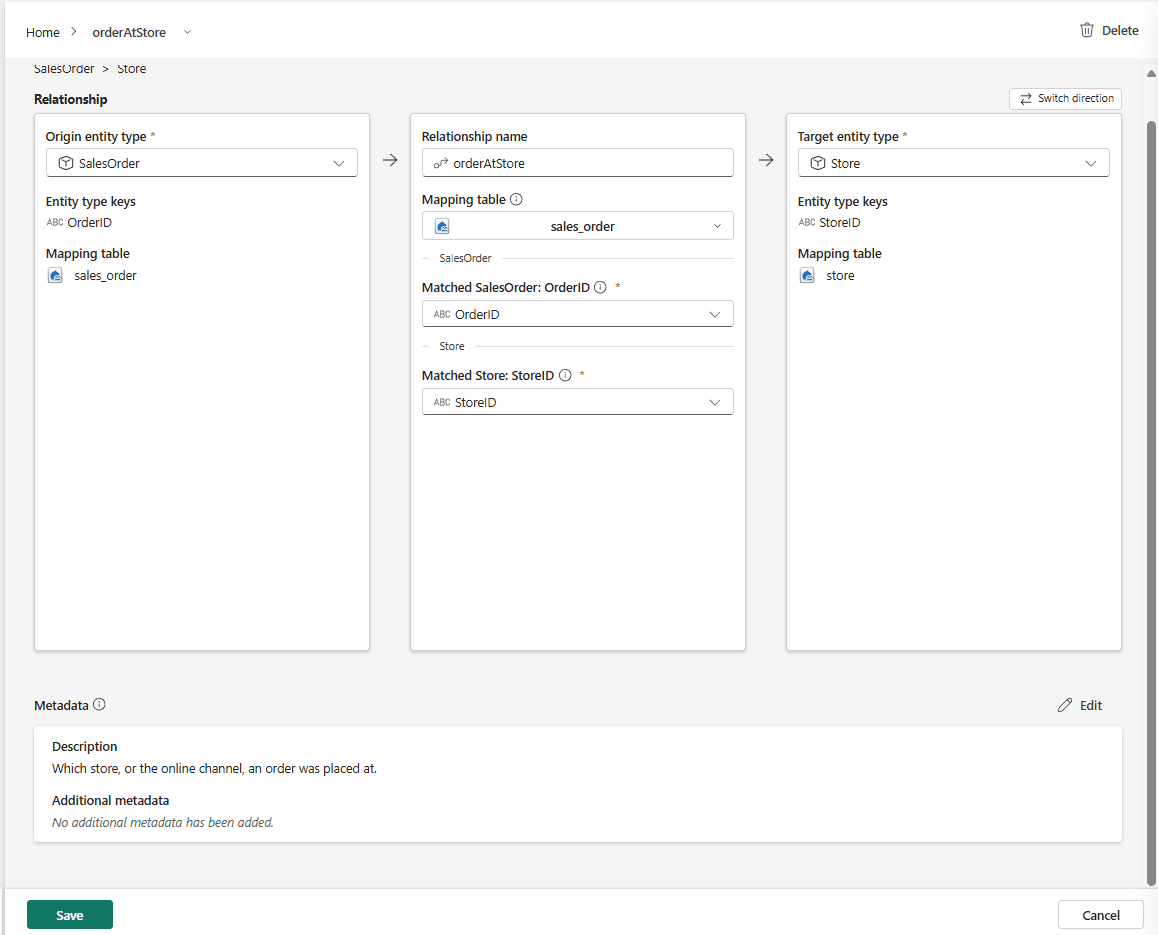
The dialog calls the mapping table optional. It isn't, for us: without one the relationship exists in the design but has no data, so the graph shows no links.
The matched columns are source column names from the table (StoreID), not the renamed properties (OrderStoreID). If a dropdown shows nothing, the entity type at that end has no key yet.
There are 22 in total. For 21 of them, the mapping table is the origin entity type's own table, as with orderAtStore above.
The special case: lineOnPromotion (which campaign a discounted order line was sold under). An order line doesn't carry a promotion column; the link lives in a separate table, order_line_promotion, with one row per discounted line. So that's the mapping table, even though no entity type is bound to it:
| Field | Value |
|---|---|
| Origin → Target | SalesOrderLine → Promotion |
| Mapping table | order_line_promotion |
| Matched SalesOrderLine: OrderLineID | OrderLineID |
| Matched Promotion: PromotionID | PromotionID |
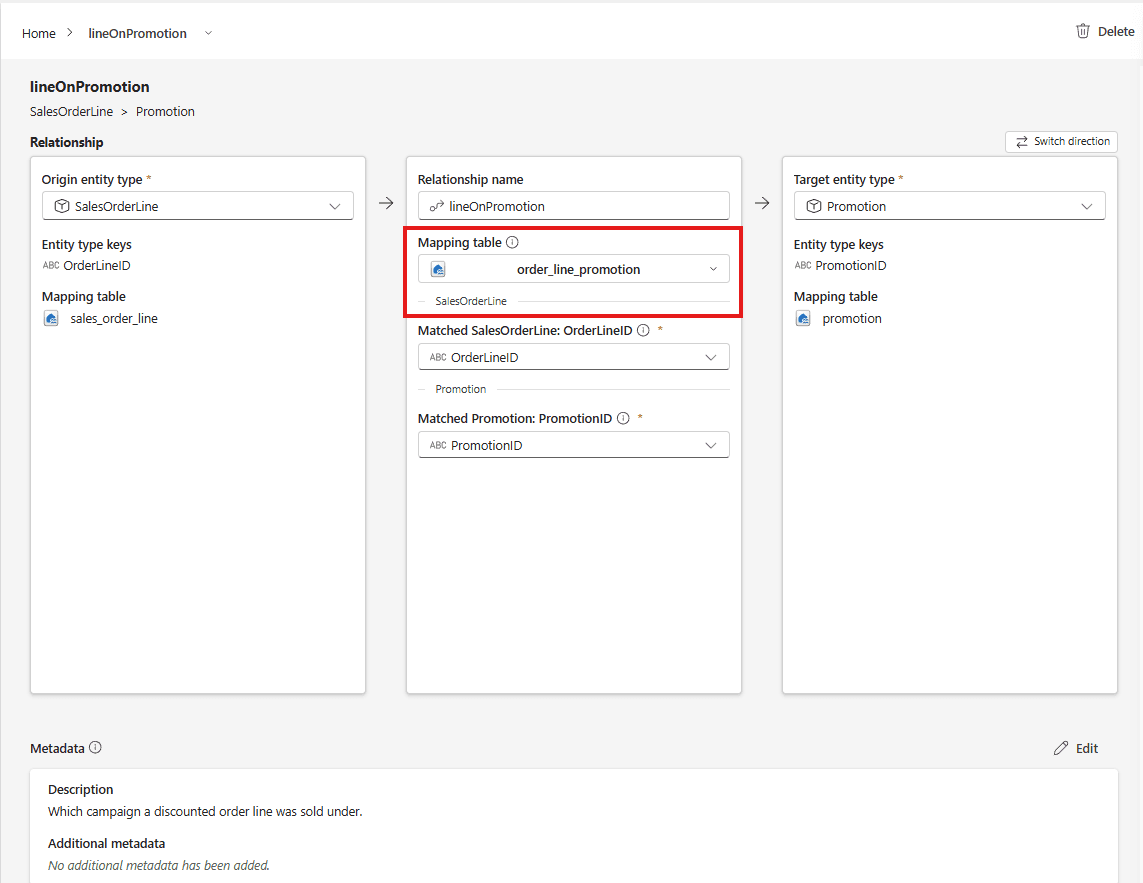
Lines sold at full price have no row there, so they simply have no promotion edge.
Checkpoint: 22 relationships on the canvas, each with a mapping table and two matched columns.
Step 11: Refresh and check the graph
In the workspace, open the ontology folder. Next to the item whose type is Graph model: … → Refresh now.
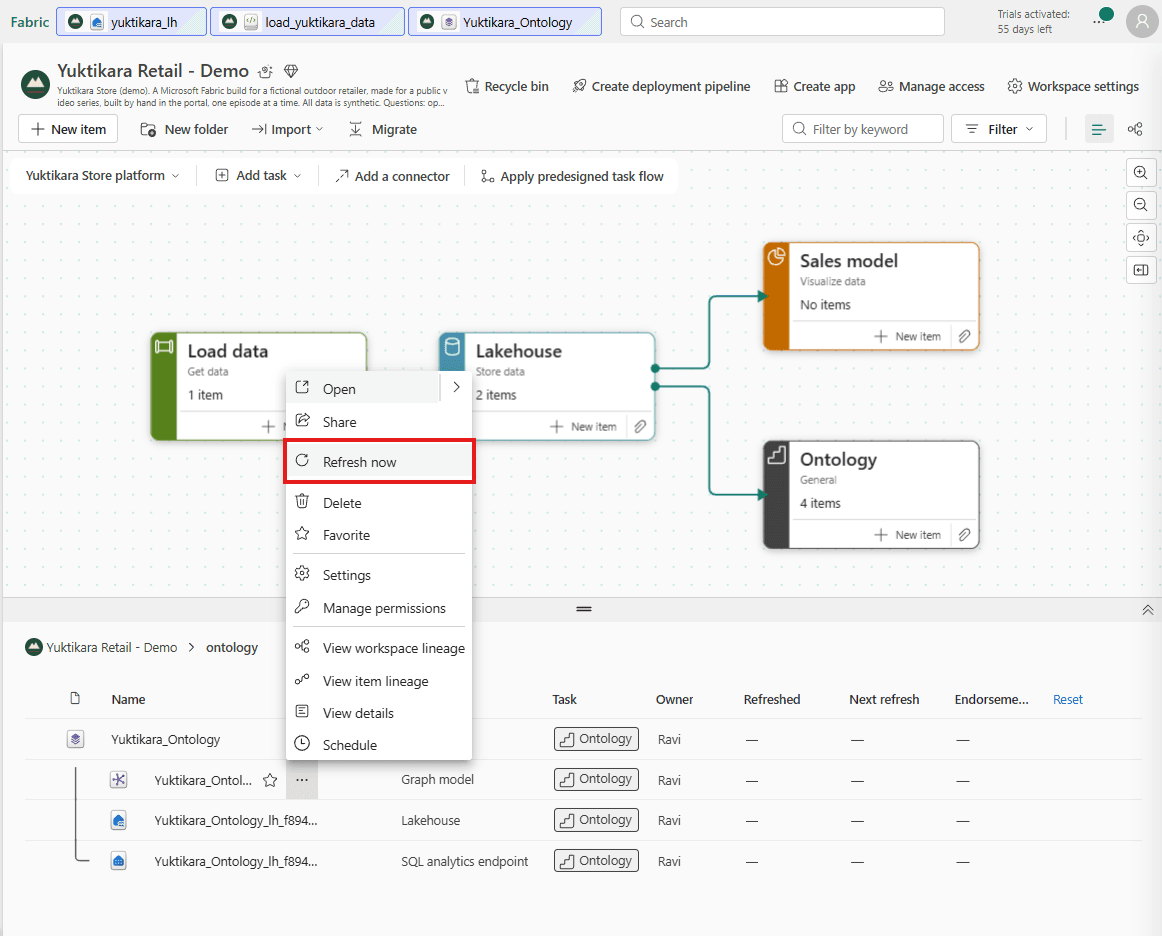
Refresh by hand whenever the data changes. Schedule, on the same menu, sets a recurring refresh; leave it unset, because every refresh rebuilds the whole graph and uses capacity.
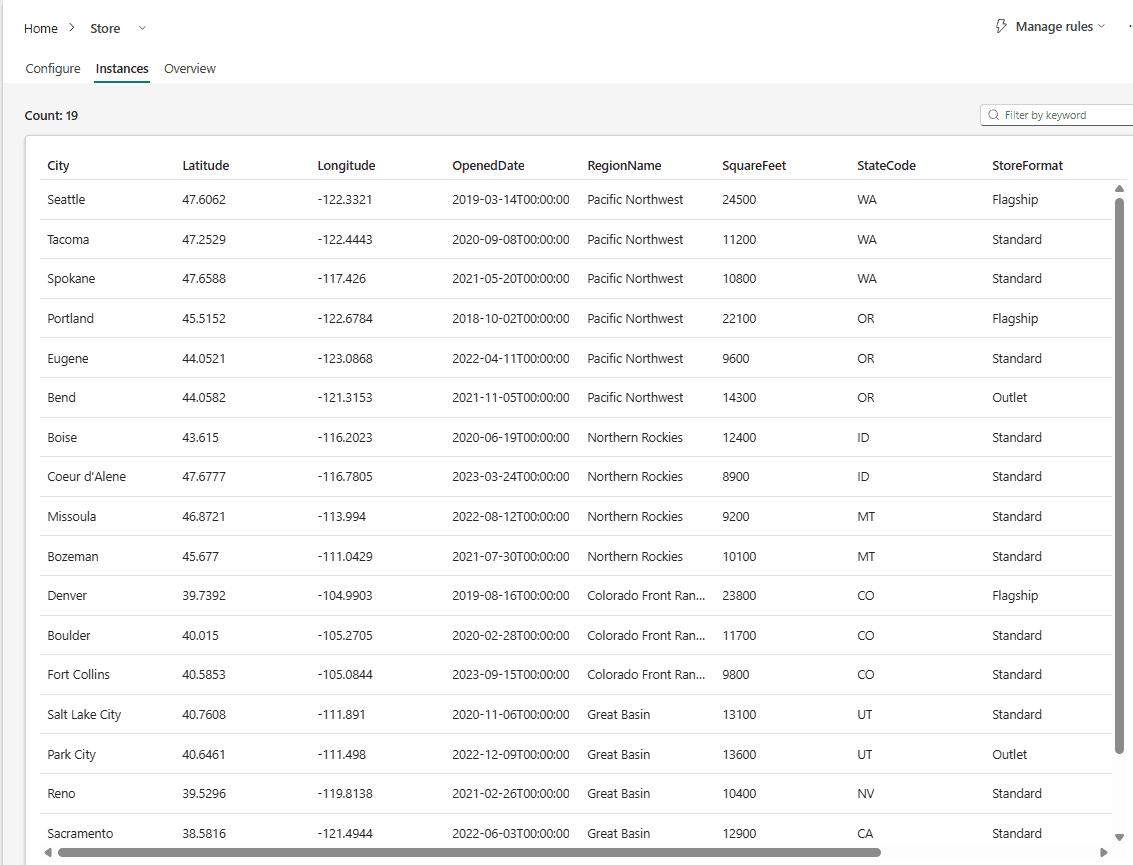
Then check the counts. Select an entity type → View entity type details → Instances:
| Entity type | Instances |
|---|---|
| Store | 19 |
| ProductStyle | 52 |
| SalesOrder | 33,757 |
| SalesOrderLine | 69,198 |
| SalesReturn | 6,749 |
| InventoryBalance | 235,460 |
Every other entity type should match its row count in manifest.json. Zero instances usually means a missing key or a wrong matched column.
Descriptions and metadata
The ontology takes two kinds, and they do different jobs:
| Kind | What it takes | Who it's for |
|---|---|---|
| Entity types and relationships | A description, synonyms (entity types only) and additional metadata | AI agents. The portal says it "helps AI agents better understand and work with your data", so add it |
| Properties | A description and additional metadata, such as unit = USD | People reading the ontology. Optional |
Where to add each:
- Entity type: on its Configure page, Entity metadata → Description, + for each synonym, + for additional metadata → Update.
- Relationship: on its page, Metadata → Edit → Description → Update, then Save.
- Property: the tag icon next to it → Description and Additional metadata → Update.
Step 12: Sneak peek at Episode 2
The foundation is done. Here's what happens when you put an AI agent on top of it. You don't need to build this now: data agents need a paid F2, and Episode 2 builds it step by step.
First try: a data agent on the ontology alone. Ask it the obvious question:
Which product has the highest return rate?
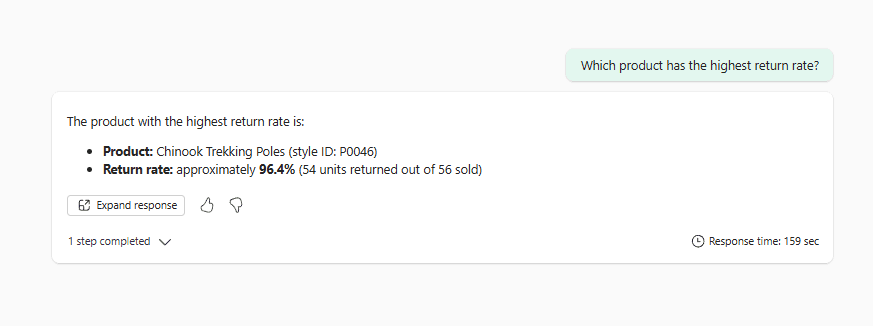
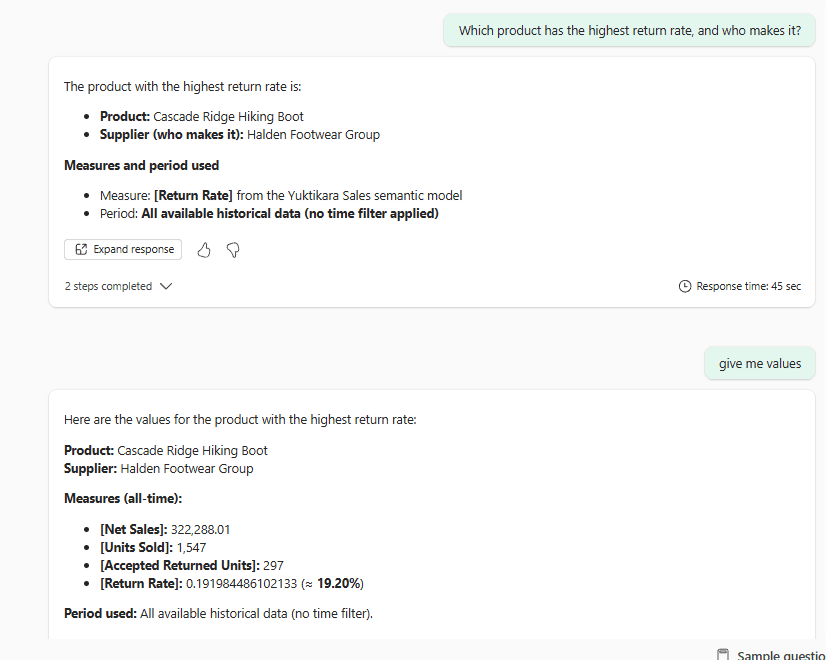
Chinook Trekking Poles at 96.4%. Nearly every trekking pole sold comes back? No. Their real return rate is 3.45%. The right answer is the Cascade Ridge Hiking Boot, at 19.20%.
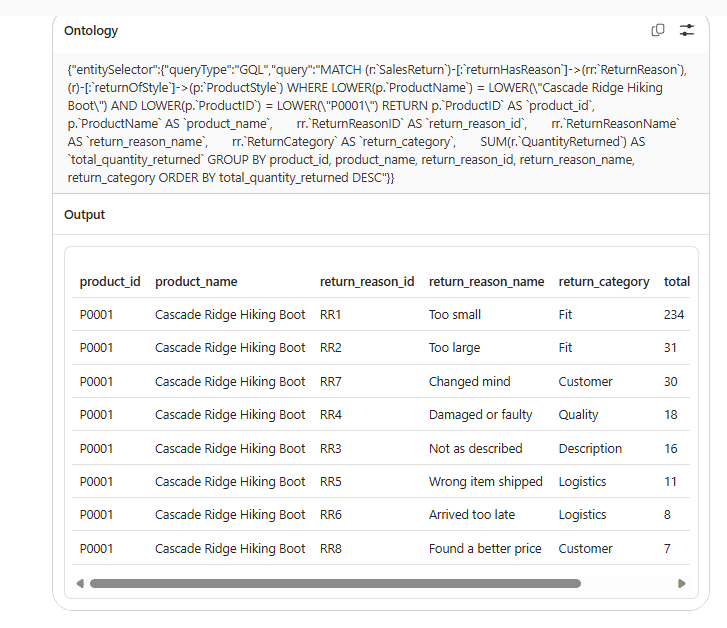
But the graph gets the "why" right. Ask why customers return the boot, and the agent walks the ontology you just built: return → reason → product.
After Episode 2: the same question.
And the question that has four plausible answers in this data, what were our sales last quarter?:
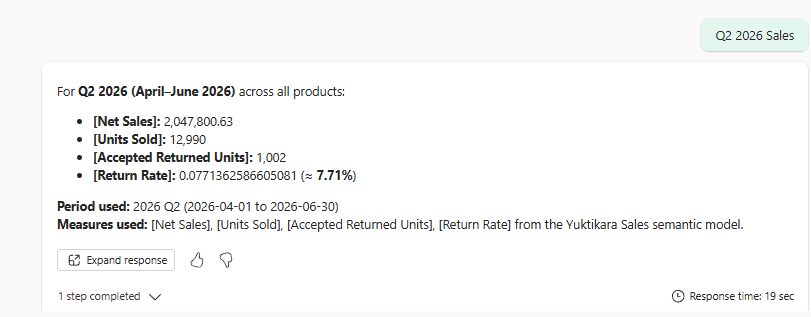
Same data, same ontology, same questions. What changed between the first answer and the last? That's Episode 2.
What you built
- A workspace with folders and a task flow
- A lakehouse with 17 typed tables in six schemas
- An ontology with 15 entity types and 22 relationships, and a graph you can walk
Next, Episode 2: switch the workspace to a paid F2, add a semantic model with the business's measures, and build the data agent on top, until it answers what were our sales last quarter? and which product comes back most? correctly.