fabric-iq
Part 2: Give the pharma cold-chain monitor a brain in Microsoft Fabric IQ, the ontology and the two agents that answer and watch
Part 1 left a pipeline scoring every truck reading against each batch's own safe band. Part 2 gives that data meaning an agent can traverse, asks it which batches are in trouble in plain language, and sets a watcher on it that recommends action in Teams.
Where Part 1 left off
Part 1 built the machine. Six static tables in the lakehouse (Stage 1). Twelve trucks streaming through an Eventstream into an Eventhouse (Stage 2). An update policy that scores every reading, at the moment it lands, against the safe band of every batch riding that truck (3.3). A materialized view holding each batch's running total (3.4).
What it did not build is a way to ask. Every answer in Part 1 was a KQL query written by someone who already knew the question. This article replaces that: an ontology that gives the tables meaning, a data agent that answers in plain language, and an operations agent that watches without being asked.
If you are landing here first, the story that drives the build, in three sentences. Aurora Pharma moves insulin and a frozen vaccine across India in twelve refrigerated trucks, and one insulin batch, AUR-2207, was destroyed by cold: two drivers held their trucks at -20°C because the paperwork said so, and no alarm watches the floor. Nobody noticed for three weeks, because frozen insulin looks exactly like good insulin. Priya, who runs quality at the Hyderabad plant, starts every morning with one question: which batches on the road right now are in trouble, and where are they? Part 1 tells that story in full; this article is where Priya finally gets to ask.
Stage numbering continues from Part 1: Stages 1 to 3 are there, Stages 4 to 6 are here. When something below says "the view from 3.4", that is Part 1's Stage 3, section 3.4.
Stage 4: write the business down in an ontology
This is the stage where the business gets written down. The building block is the entity type: the definition of one kind of thing the business has, like Truck or Batch. Each row of the matching table later becomes one instance of it, one real truck, one real batch. Bound means wired to real data: a binding points an entity type at the table or stream whose columns fill its properties. Defining a type and binding it are two separate acts, and this stage does them in a fixed order on purpose: define the type, choose its key, bind its static table, and only then bind a live stream to it. Section 4.7 shows why the order is enforced.
Six entity types:
| Entity type | Key | Bound to |
|---|---|---|
| Site | SiteID | sites |
| Products | ProductID | products. Holds MinSafeC, MaxSafeC and BudgetMinutes, which is where every rule in this build gets its numbers. |
| Shipment | ShipmentID | shipments |
| Leg | LegID | legs. One hop of a journey. |
| Truck | TruckID | trucks plus the live reefer_telemetry stream |
| Batch | BatchID | batches plus the derived BatchExposureMV |
4.1 Create the ontology
In the AuroraIQ workspace from Part 1, select + New item → search for and select Ontology (preview) → name it AuroraOntology → Create. If Ontology (preview) does not appear in the item list, the two tenant settings from the callout above are off, or still taking effect; that is the only reason it hides.
Ontology names take letters, numbers and underscores. No spaces, no dashes.
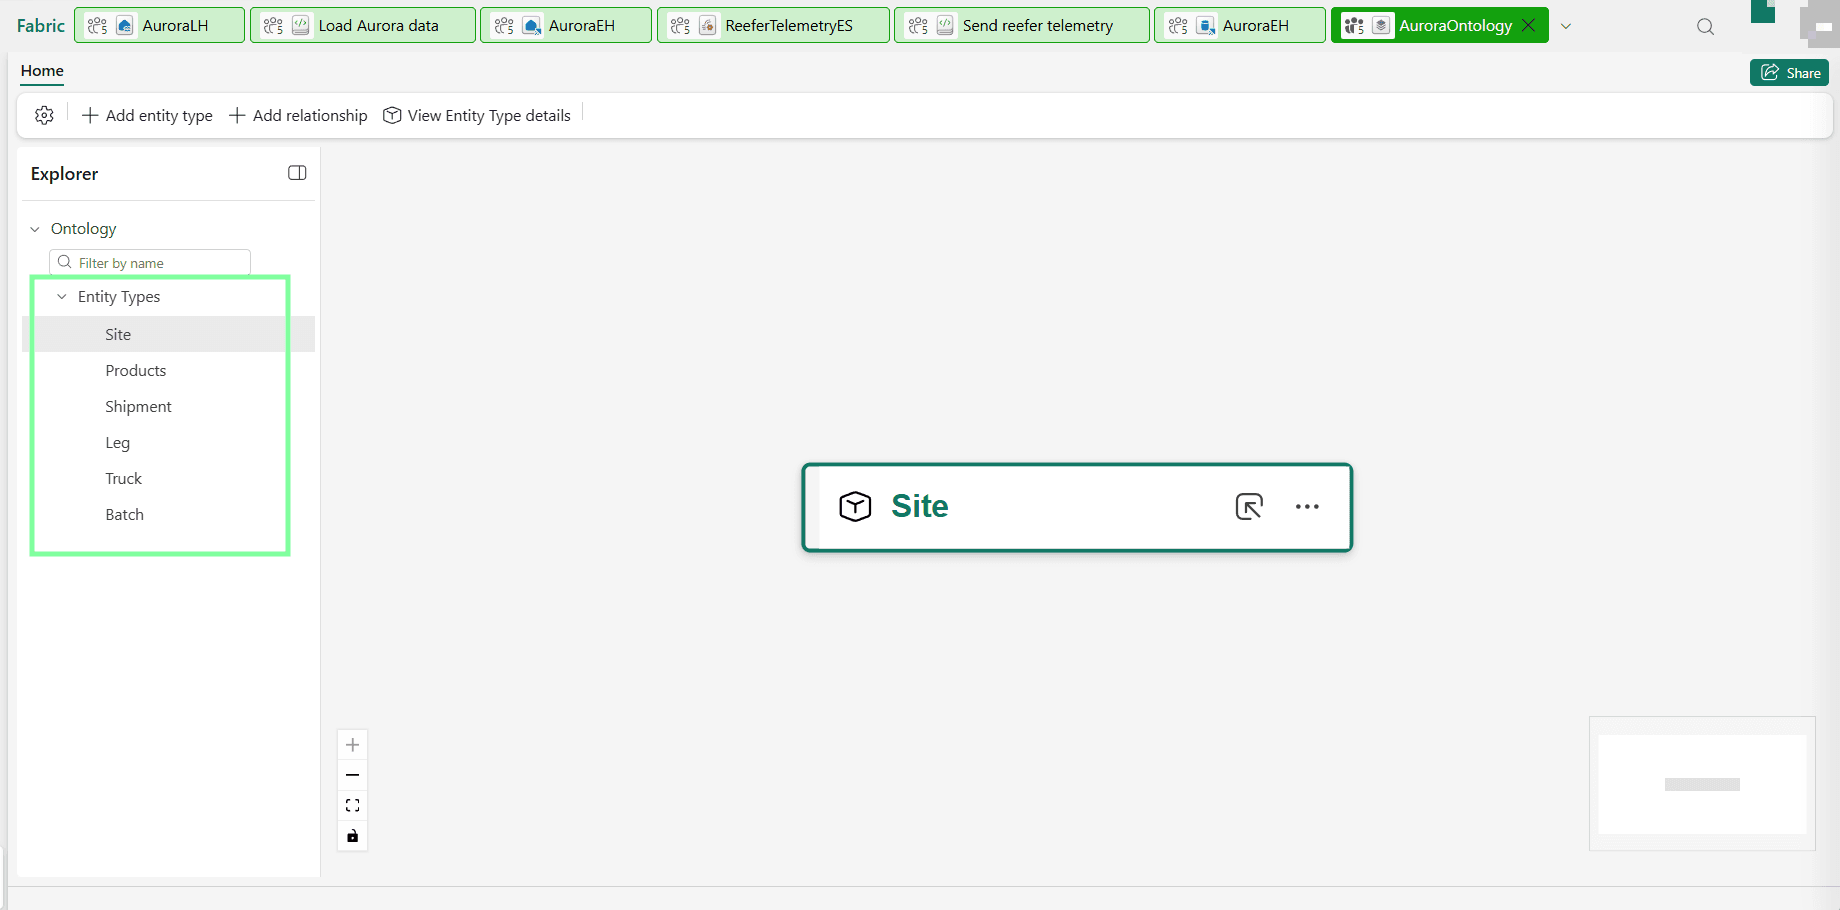
The empty canvas offers one thing: + Add entity type. Off to the left is the Explorer pane, which will fill up as you go.
One thing happened quietly that matters later. Creating the ontology also created a Graph in Microsoft Fabric child item in your workspace, named after your ontology with _graph and a long identifier on the end. You never edit it directly, but it stores the materialized graph: the actual network of dots and connecting lines that Fabric builds from your entity types and their bound data, the thing queries and agents really run against. Materialized just means built and saved, rather than worked out fresh on every question.
Its schema follows the ontology by itself, so it fills in as you work. Its data does not: open the item and select Get data to load that, and again whenever the tables underneath change. Its footer keeps two clocks, Last saved for the schema and Last loaded for the data, and the gap between them is exactly how stale the graph is.
4.2 Create the six entity types
Select + Add entity type. The Add Entity Type dialog asks for one thing, Entity type name, and confirms with a button of the same name.
Do all six now: Site, Products, Shipment, Leg, Truck, Batch.
When you are done, the Explorer pane on the left lists all six under Entity Types. They are empty shells so far: no properties, no key, no data.
4.3 Give Site its properties
Select Site in the Explorer, then View Entity Type details in the ribbon. The detail page opens on the Configure tab, with Instances and Overview beside it.
On the Properties card, expand Manage property bindings and select + Add properties.
The Add properties to Site modal has two columns, Name and Property type, and a + Add button that adds one row at a time. There is no bulk paste. Fill in:
| Name | Property type |
|---|---|
| SiteID | String |
| Name | String |
| City | String |
| State | String |
| SiteType | String |
Select Save.
Now look at the property list you just made, because it is making an argument.
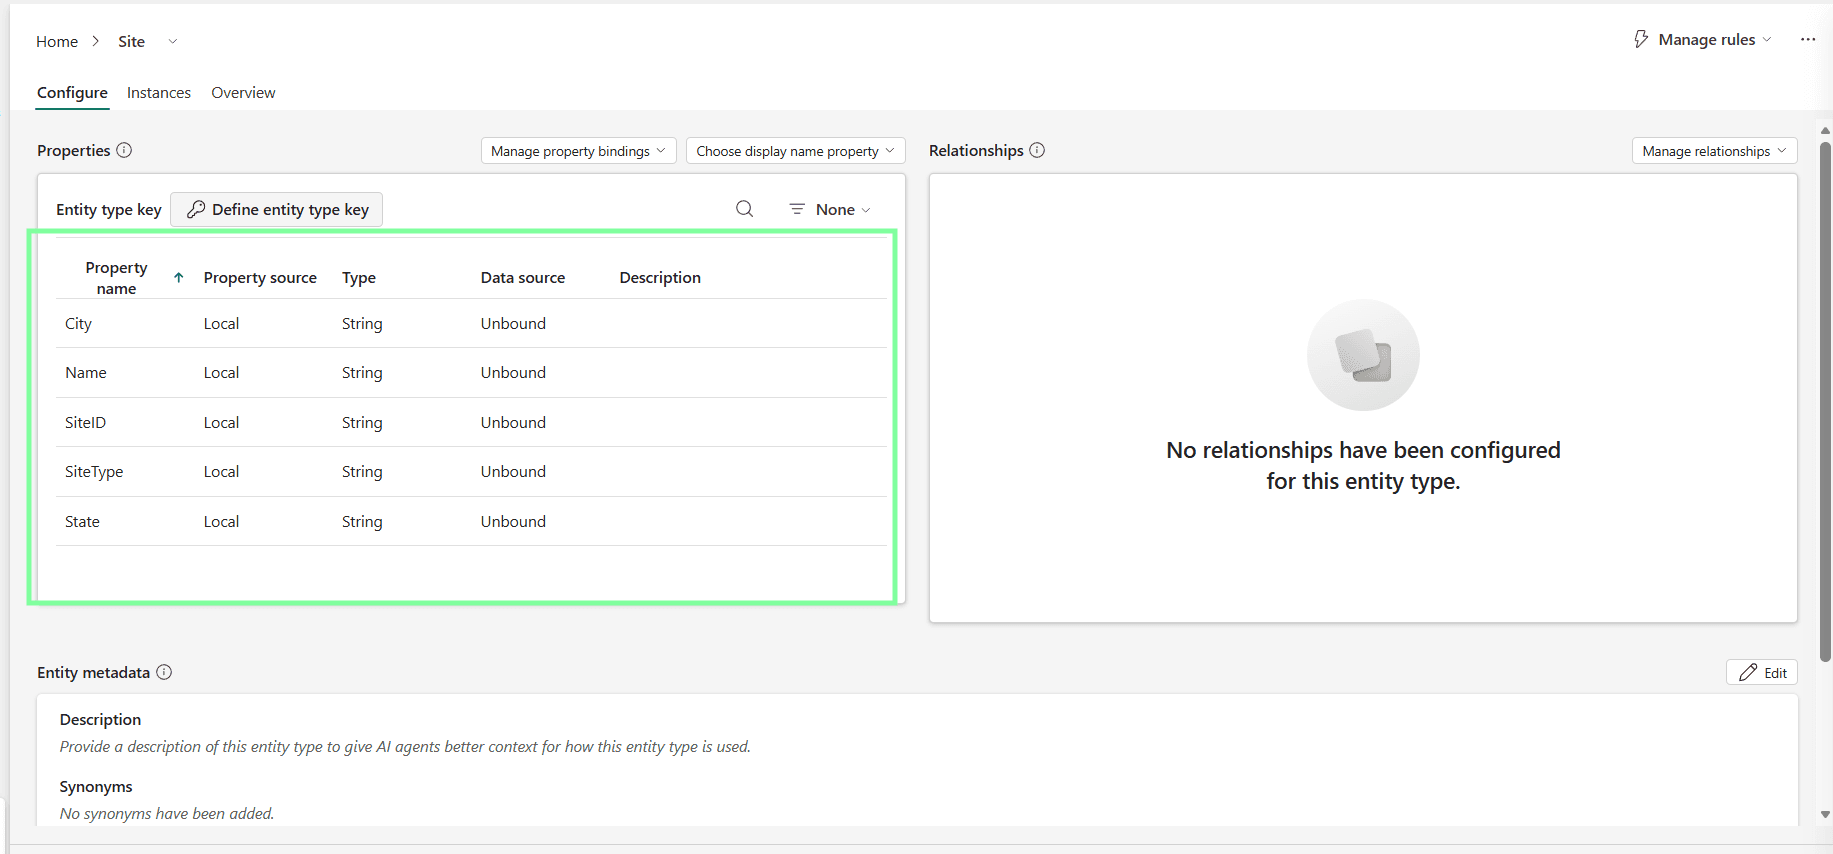
4.4 Define the key
The key is the property whose value picks out exactly one instance: one SiteID, one site. It is how the graph tells two instances apart, and how every binding knows which rows belong to which instance.
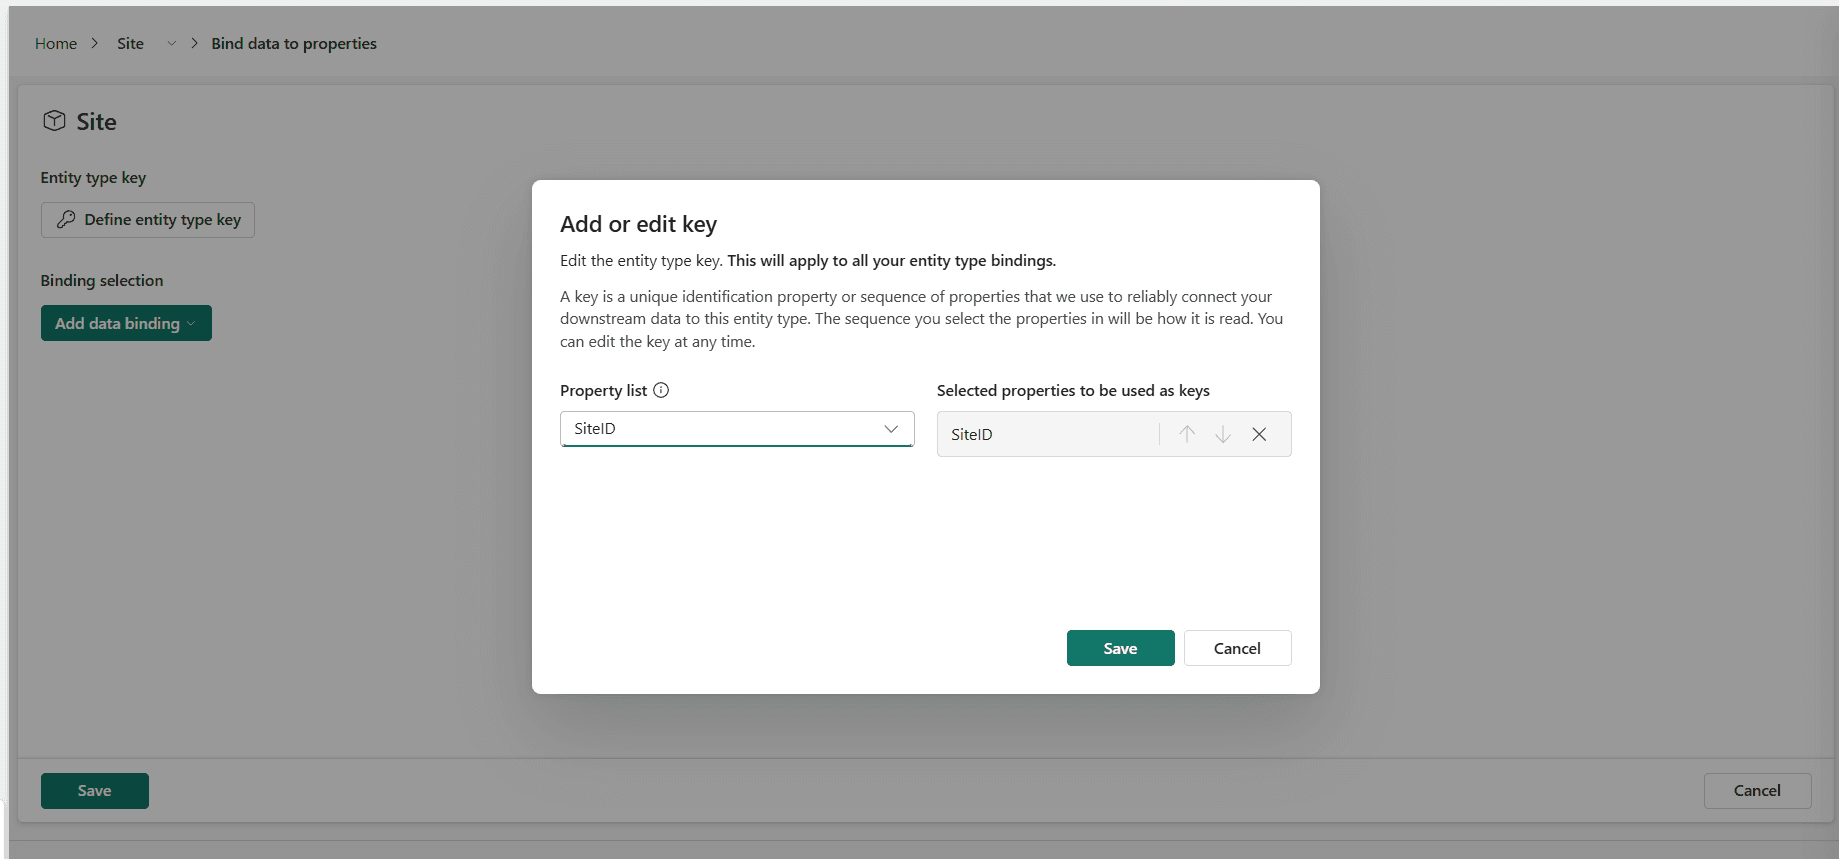
Select Define entity type key. In the Add or edit key dialog, open the Property list dropdown, choose SiteID, and it appears under Selected properties to be used as keys on the right. Select Save.
4.5 Choose the display name
Back on the Configure tab, in the Properties card header, select Choose display name property and pick Name.
There is no dialog and no save button here. It is a dropdown, and the choice takes effect immediately.
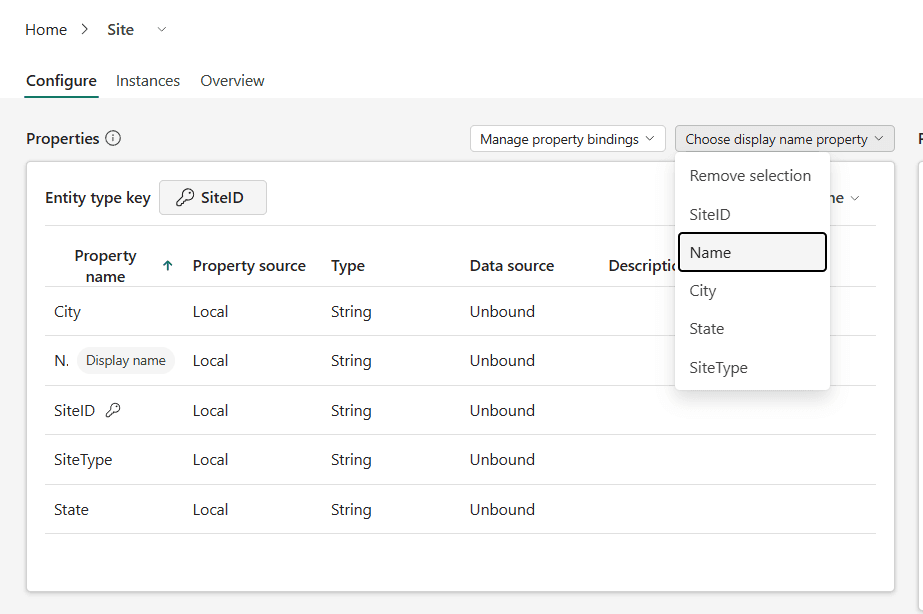
The table records both decisions. SiteID picks up a key icon, Name picks up a Display name badge, and Entity type key at the top now reads SiteID instead of offering to define one. The dropdown's first entry, Remove selection, undoes the choice.
Skip this and instances read as SITE-HYD-PL everywhere instead of Aurora Hyderabad Plant. It costs one click and it decides how legible every later screen is.
4.6 Bind Site to its table
Back on Configure, expand Manage property bindings again, and this time select + Add binding and properties.
The Bind data to properties page has four sections: Entity type key, Binding selection, Entity type key mapping, and Properties.
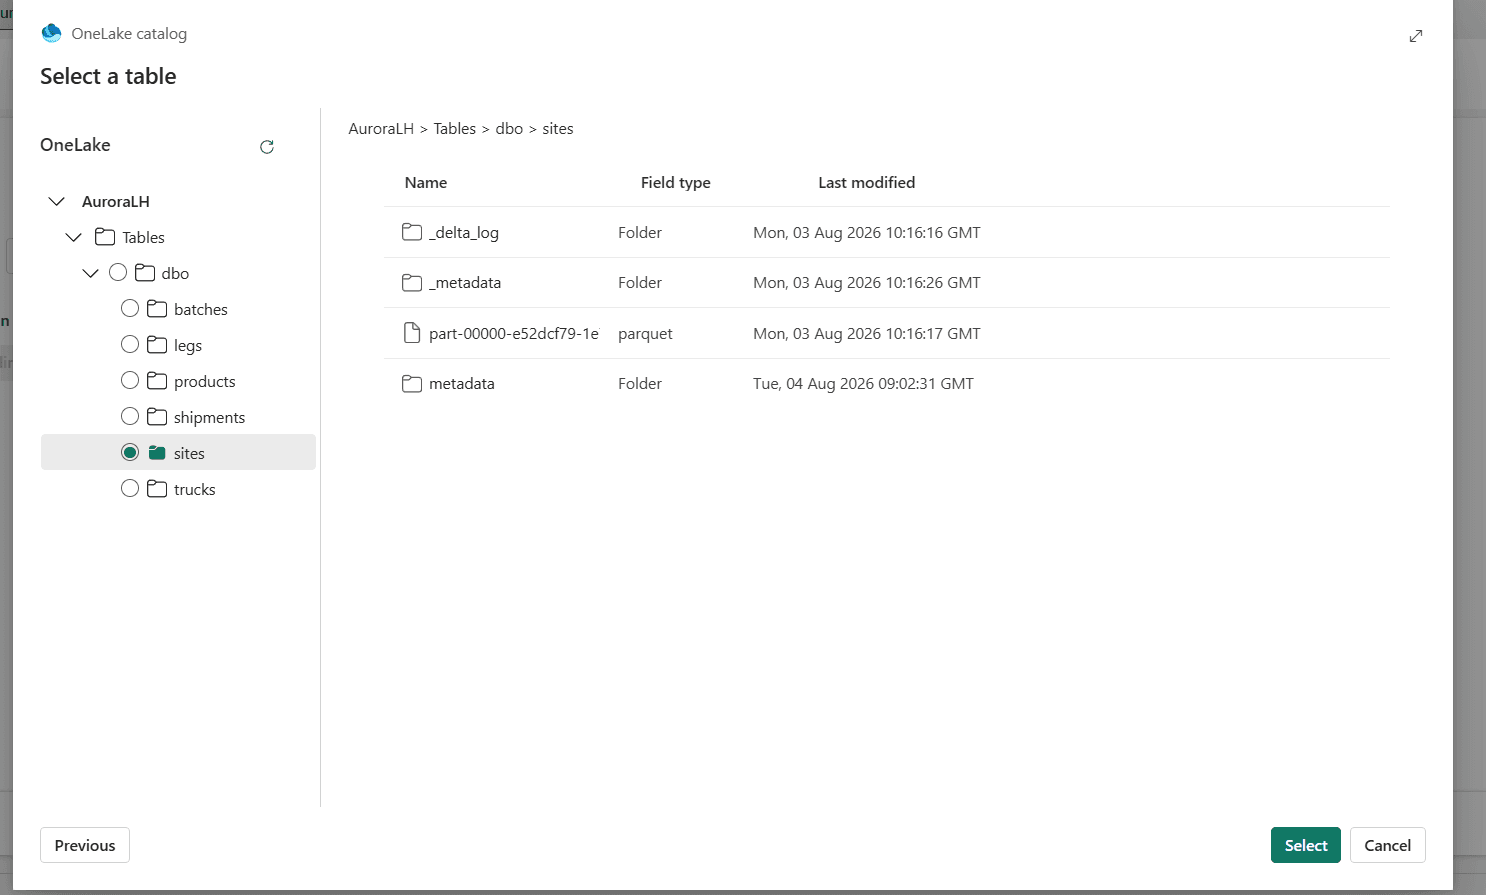
Under Binding selection, expand Add data binding and select Lakehouse table. The OneLake catalog picker opens on Select a table: expand AuroraLH → Tables → dbo, choose sites, and select Select.
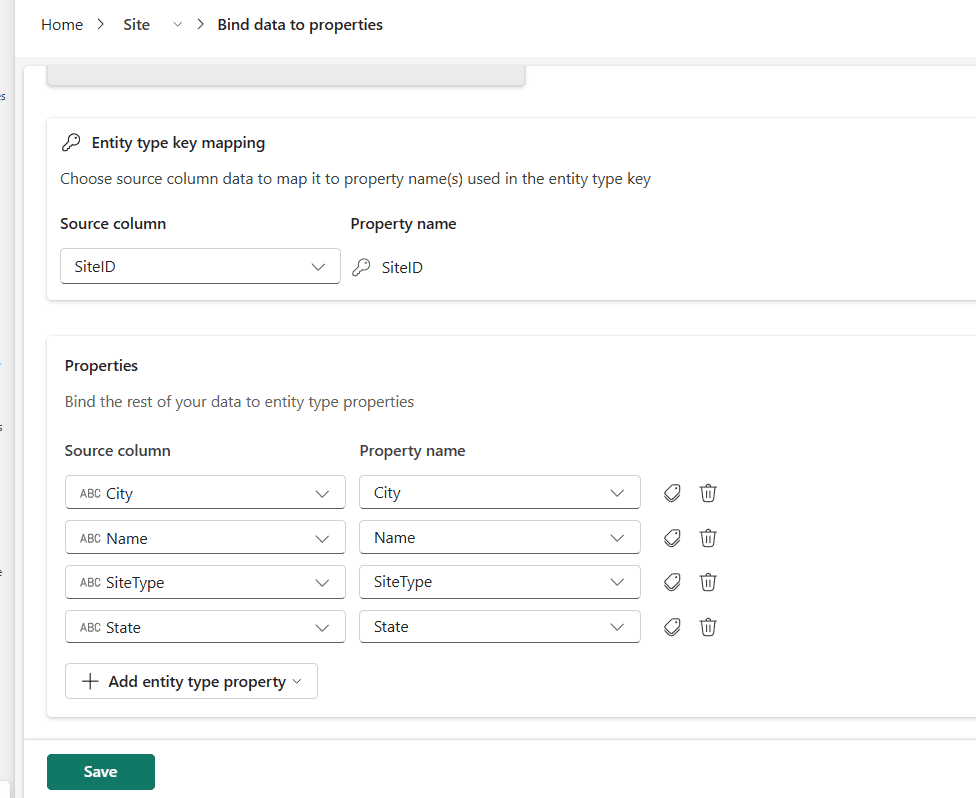
Now the last two sections fill in. Entity type key mapping handles the key on its own, separately from everything else: pick SiteID as the Source column, and it maps to the SiteID property already marked with the key icon. Properties takes the rest, one row per property, Source column on the left and Property name on the right.
Fabric matches them for you, and it matches on name. Because the properties in 4.3 were typed to match the CSV headers exactly, all four arrive filled in. Check every row rather than trusting it, then Save.
Now repeat 4.3 through 4.6 five more times, once each for Products, Shipment, Leg, Truck and Batch. Do all five before moving on: the live bindings in 4.7 and 4.8 refuse to attach until the entity's static binding exists.
First the properties (4.3). Each list is in its CSV's own column order, so you can read the header row and type straight down it:
| Entity type | Properties (Name : Property type) |
|---|---|
| Products | ProductID : String, Name : String, Form : String, MinSafeC : Double, MaxSafeC : Double, BudgetMinutes : Integer, FreezeAllowed : String, UnitValueUSD : Double |
| Shipment | ShipmentID : String, OriginSiteID : String, DestinationSiteID : String, DepartUtc : Datetime, Status : String |
| Leg | LegID : String, ShipmentID : String, TruckID : String, FromSiteID : String, ToSiteID : String, LegSeq : Integer, DepartUtc : Datetime, ArriveUtc : Datetime |
| Truck | TruckID : String, Registration : String, ReeferModel : String, Operator : String |
| Batch | BatchID : String, ProductID : String, ShipmentID : String, Units : Integer, ValueUSD : Double, ManufacturedDate : Datetime, ExpiryDate : Datetime |
Then the key, the display name, and the table to bind (4.4 to 4.6):
| Entity type | Key | Display name | Lakehouse table |
|---|---|---|---|
| Products | ProductID | Name | products |
| Shipment | ShipmentID | ShipmentID | shipments |
| Leg | LegID | LegID | legs |
| Truck | TruckID | Registration | trucks |
| Batch | BatchID | BatchID | batches |
When you finish, every entity's property list shows its table name in the Data source column, with no row still reading Unbound.
4.7 The Truck's second binding: live telemetry
Truck already knows what it is. Now give it a pulse.
This is the step the City Cart build, this site's earlier e-commerce walkthrough, photographed and declined, because an online shop has no sensors. Aurora does.
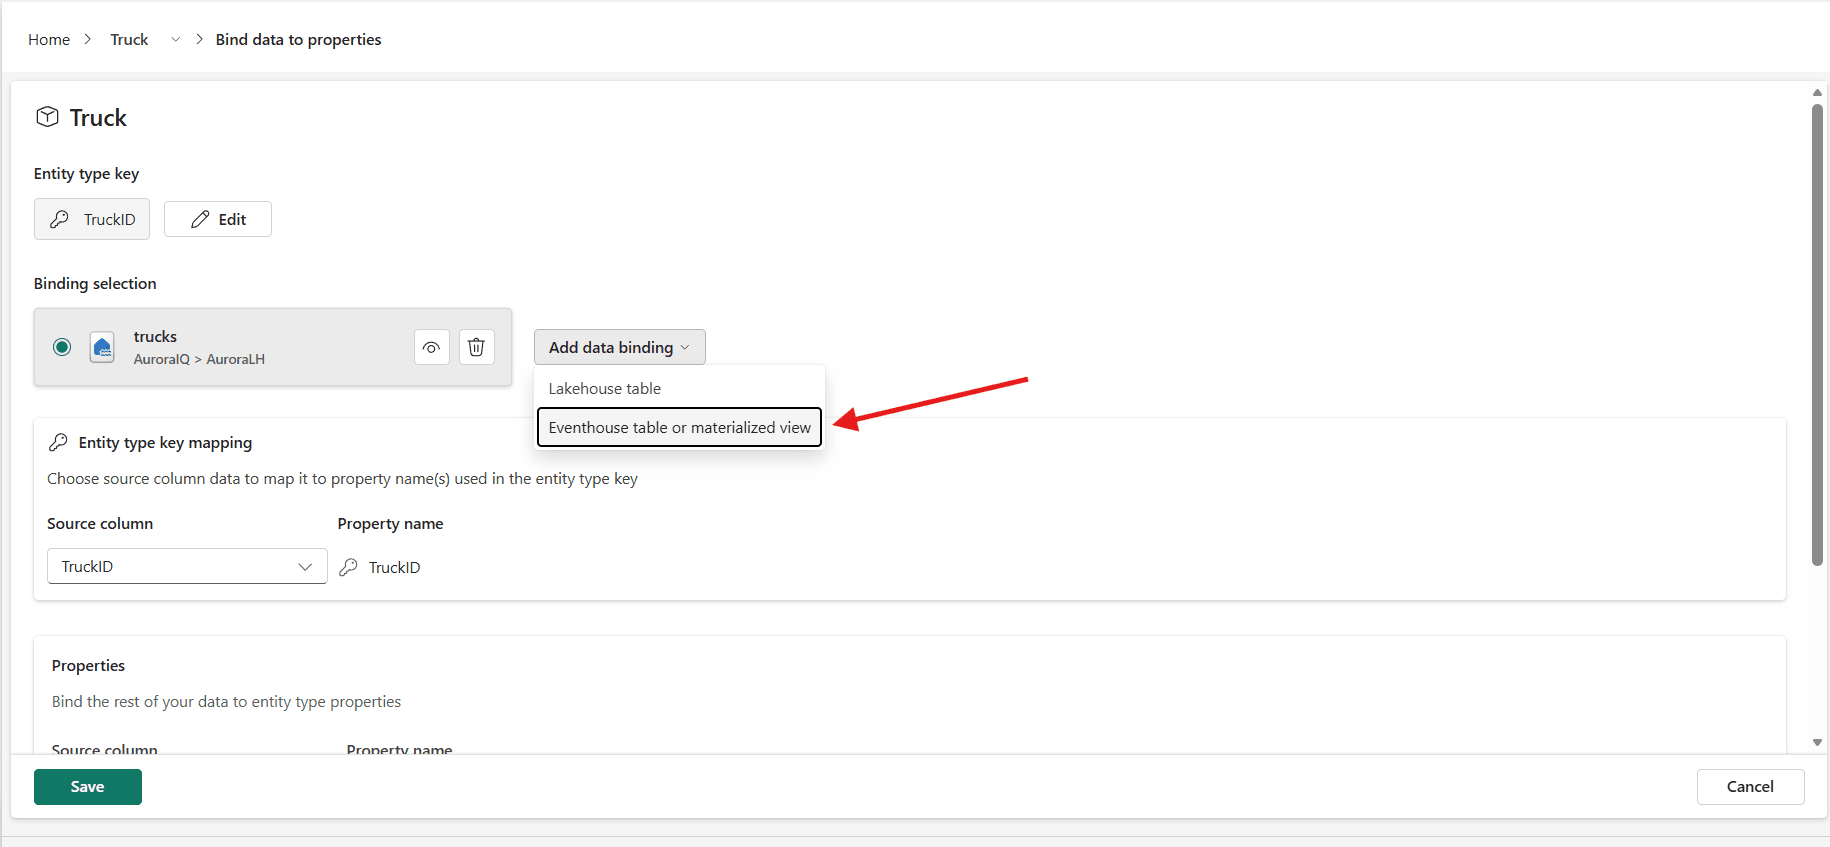
Open Truck → Configure → Manage property bindings → + Add binding and properties. The page looks different from Site's, because Truck already has a binding: Entity type key now shows TruckID and an Edit button rather than offering to define one, and Binding selection holds a card for the trucks binding you made in 4.6, tagged with where it came from, AuroraIQ > AuroraLH.
Expand Add data binding. It offers exactly two things, and this time you want the second: Eventhouse table or materialized view.
Choose the AuroraEH Eventhouse, select Add, choose the reefer_telemetry table, select Add again. (The Lakehouse path used Previous then Select; the Eventhouse path uses Add twice. Same family of dialog, different buttons.)
Now a second card sits next to the first, reefer_telemetry from AuroraIQ > AuroraEH, and a section appears that the lakehouse binding never showed: Timeseries data. Fabric explains itself here — "One or more columns have been identified as date/time data. Select a column that represents an event or measurement timestamp identifying these properties as timeseries." A time series is a list of values where each value carries the moment it was measured, which is exactly what the temperature log is. Choose Timestamp.
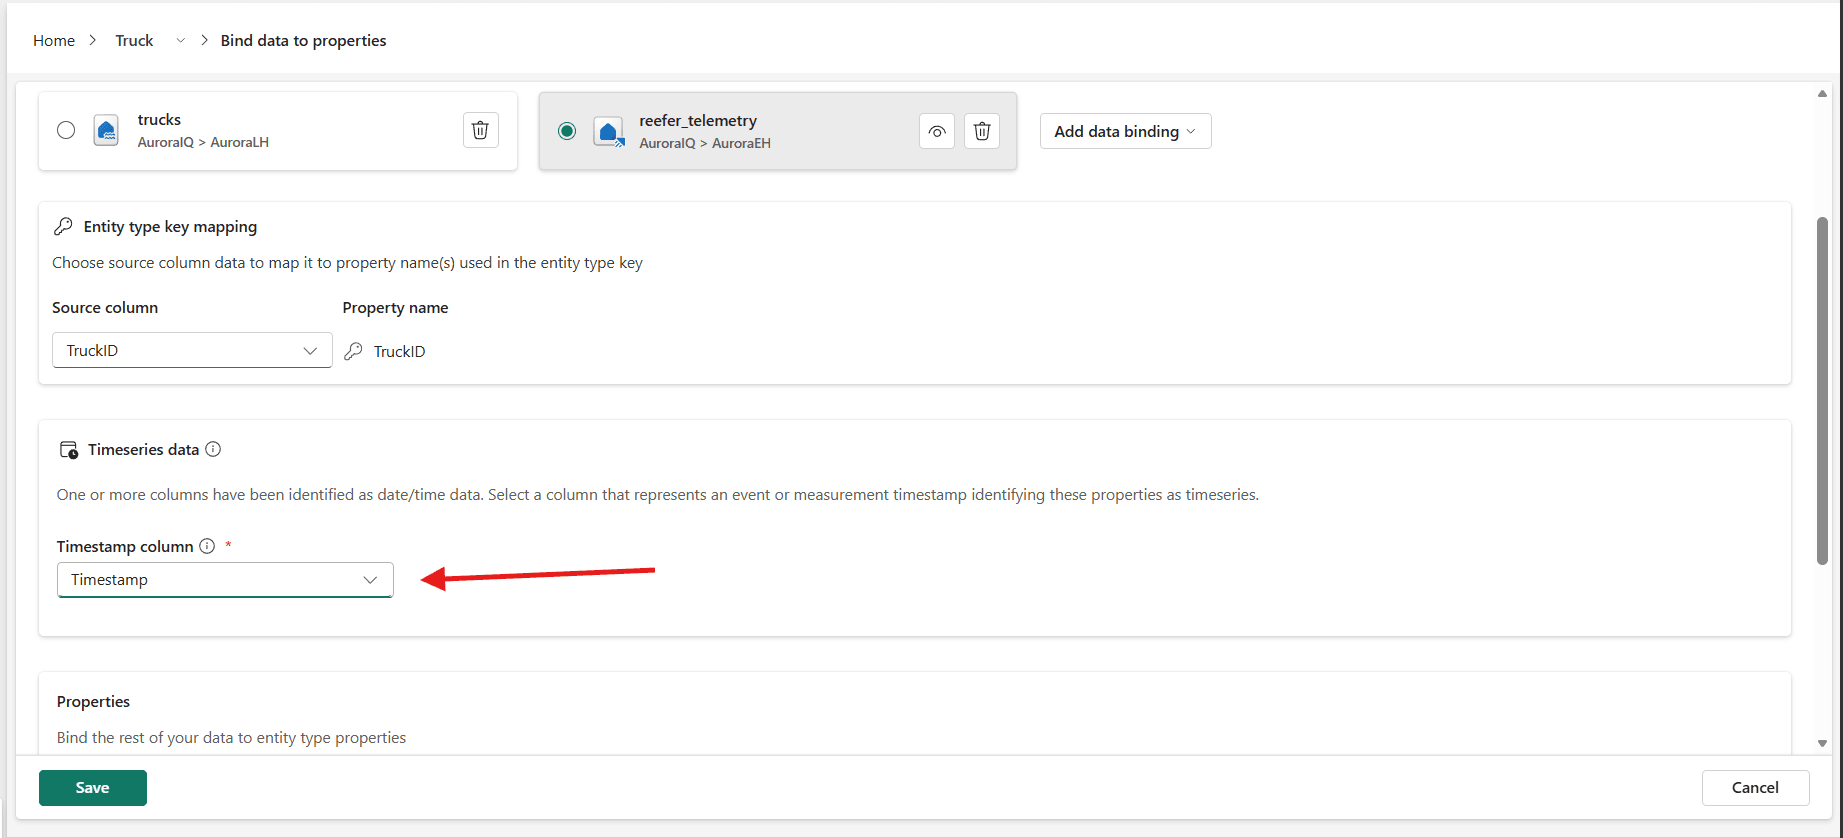
Note the red asterisk on Timestamp column. On this binding it is required, not optional — without it there is no time series, only another table of columns.
In Properties, TruckID will show an error because it is already bound in the static binding. Delete that row with the trash icon. Keep TempC, HumidityPct and IntervalMinutes. Save.
The order is enforced, and the docs are explicit about why: "Before you bind time series data to an entity type, make sure your static data binding is complete. The entity type must have at least one property with static data bound to it that you can use as the key to contextualize your time series data. This static data must exactly match a column in your time series data."
In plain terms: TruckID in trucks and TruckID in reefer_telemetry must hold the same values, because that is the only thing tying a reading to a vehicle.
4.8 The Batch's second binding: derived exposure
Do the same for Batch, but this time the source is not a table at all.
The dialog that opens is called Add Eventhouse data source. Pick AuroraEH, then open Select a table or materialized view. The list is grouped into two headings, and the second one is the one that matters: under Tables sit reefer_telemetry, leg_cargo, excursion_events and batch_exposure; under Materialized Views sits BatchExposureMV, the running total Part 1's 3.4 built. Choose it.
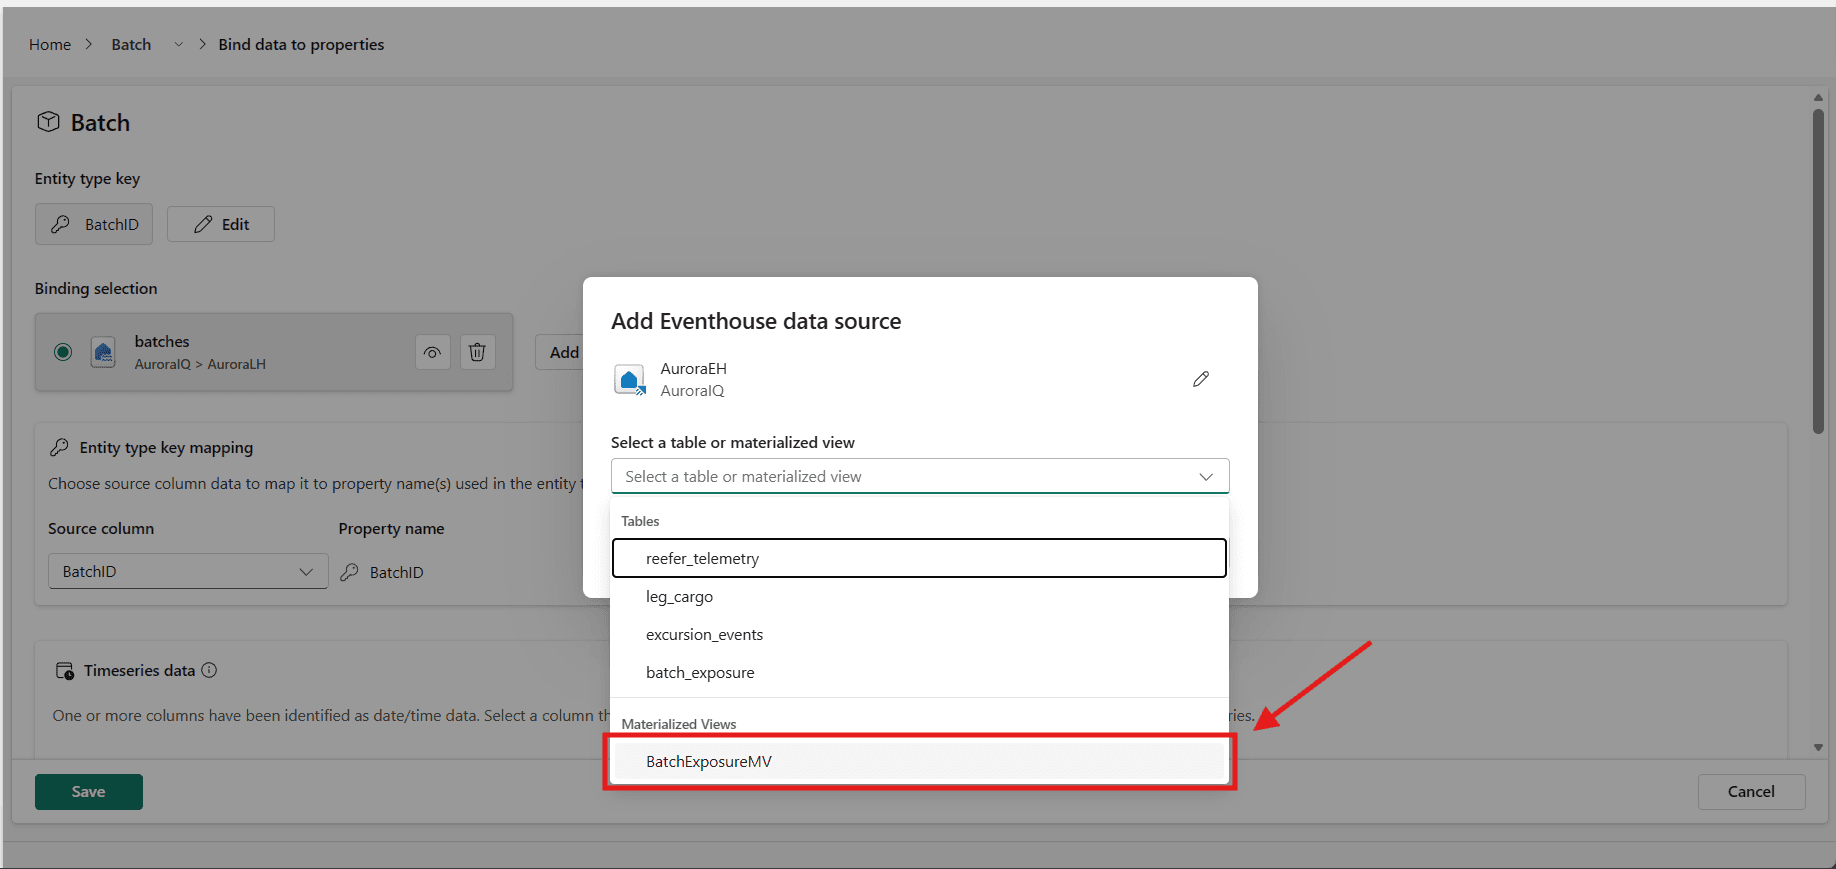
That heading is worth pausing on. An entity type can bind to something the engine computes and keeps fresh, not just to something a file wrote down. Batch's exposure is not stored anywhere as a column; it is the sum of every scored reading across every leg, maintained by the view. The ontology binds to that.
Timestamp column is LastReading. Delete the duplicate BatchID row. Keep CumulativeMinutes, HotMinutes, ColdMinutes, BudgetUsedPct and FreezeEventCount.
HotMinutes and ColdMinutes are the two that split the total by direction, and 5.3 is where you find out why that matters.
Now compare the two entities you just built, because this is the design in miniature.
Truck carries the raw stream. It is what the sensor produces, and it means nothing on its own.
Batch carries the derived stream. It is what compliance asks about, computed in KQL where the joins and the product limits live.
Raw telemetry for the thing that has a sensor. Interpreted meaning for the thing that has a quality file. Both are time-series properties on an ontology entity, and the difference between them is the whole architecture.
4.9 Write down what the columns cannot say
Fabric IQ lets you attach descriptions and synonyms at every level, and this is where the business rules go.
Entity metadata is not in the entity's ⋯ menu in the Explorer, which offers Bind data, Add relationship, Manage rules, Overview and Delete. It is at the bottom of the Configure tab: select the entity, then View Entity Type details in the ribbon, and scroll past the Properties card to Entity metadata. Select Edit on its right edge. You get a Description, Synonyms as one chip per term rather than a comma-separated string, and Additional metadata as key-value pairs. Confirm with Update, not Save.
Property metadata is a separate dialog, one per property, titled Edit metadata for {property} property. It offers a Description and Additional metadata, but no synonyms — only entity types get those. Ignore its Description placeholder, which talks about entity types; this field describes the one column.
Three descriptions carry this article. Paste each one into the property's Description field:
| Where | Description to paste |
|---|---|
Products.MinSafeC | The lowest temperature this product may reach, in Celsius. The band belongs to the product, not the vehicle: chilled products run 2 to 8, the frozen vaccine runs -25 to -15. A reading below this value is a freeze, counted in FreezeEventCount, and a single one destroys the batch no matter how little budget it has used. |
Products.MaxSafeC | The highest temperature this product may reach, in Celsius. The band belongs to the product, not the vehicle: chilled products run 2 to 8, the frozen vaccine runs -25 to -15. A reading above this value is heat damage, which accrues against the budget rather than destroying the batch outright. |
Products.BudgetMinutes | Total minutes this product may spend outside its band, above MaxSafeC or below MinSafeC, across its whole journey before the batch must be quarantined. Freezing consumes budget and separately destroys the batch, so a frozen batch can show a budget far past 100 percent without ever having been too warm. The budget is a company policy, not a regulation. |
Batch.FreezeEventCount | Any value above zero is a quarantine trigger regardless of budget used. Freezing has no allowance at all. |
To quarantine a batch is to set it aside and block it from sale until a named quality person decides whether to release or destroy it.
Synonyms worth adding, one chip per term:
| Entity type | Synonyms |
|---|---|
Batch | lot, consignment |
Truck | reefer, vehicle, carrier |
Site | depot, facility |
Leg | hop, segment |
4.10 Draw the six relationships
Six of them, and they are what turn six tables into a journey.
A relationship needs three things: a name, a direction (from one entity type to another), and a binding that tells Fabric which table holds the matching pairs. That table is the mapping table: the one already carrying the foreign key. batches has a ProductID column, so batches is what proves which Batch is of which Products.
Select + Add relationship in the ribbon. The configuration page is laid out as the sentence it makes: Origin entity type on the left, the relationship in the middle, Target entity type on the right, with arrows between them and a Switch direction button if you get them the wrong way round.
Only the middle card takes input. Name the relationship, choose the Mapping table, then fill the two Matched dropdowns underneath — they are labelled with the entity and the key they have to satisfy, so ofProduct asks for Matched Batch: BatchID and Matched Products: ProductID, and both are required. The side cards are read-only: each one reminds you of that entity's key and the table it is bound to.
| Relationship | Origin | Target | Mapping table | Matched origin | Matched target |
|---|---|---|---|---|---|
| ofProduct | Batch | Products | batches | BatchID | ProductID |
| shippedIn | Batch | Shipment | batches | BatchID | ShipmentID |
| partOf | Leg | Shipment | legs | LegID | ShipmentID |
| carriedBy | Leg | Truck | legs | LegID | TruckID |
| departsFrom | Leg | Site | legs | LegID | FromSiteID |
| arrivesAt | Leg | Site | legs | LegID | ToSiteID |
Both matched columns come from the mapping table, never from the two entities' own tables. That is the whole trick: batches already carries a BatchID and a ProductID on every row, so it can prove which Batch is of which Products without either entity knowing about the other.
Note Products, the plural, in the Target column: the reserved-word workaround from this stage's opening. Type Product and the dropdown has nothing to offer.
Filled in, the first row reads back like this:
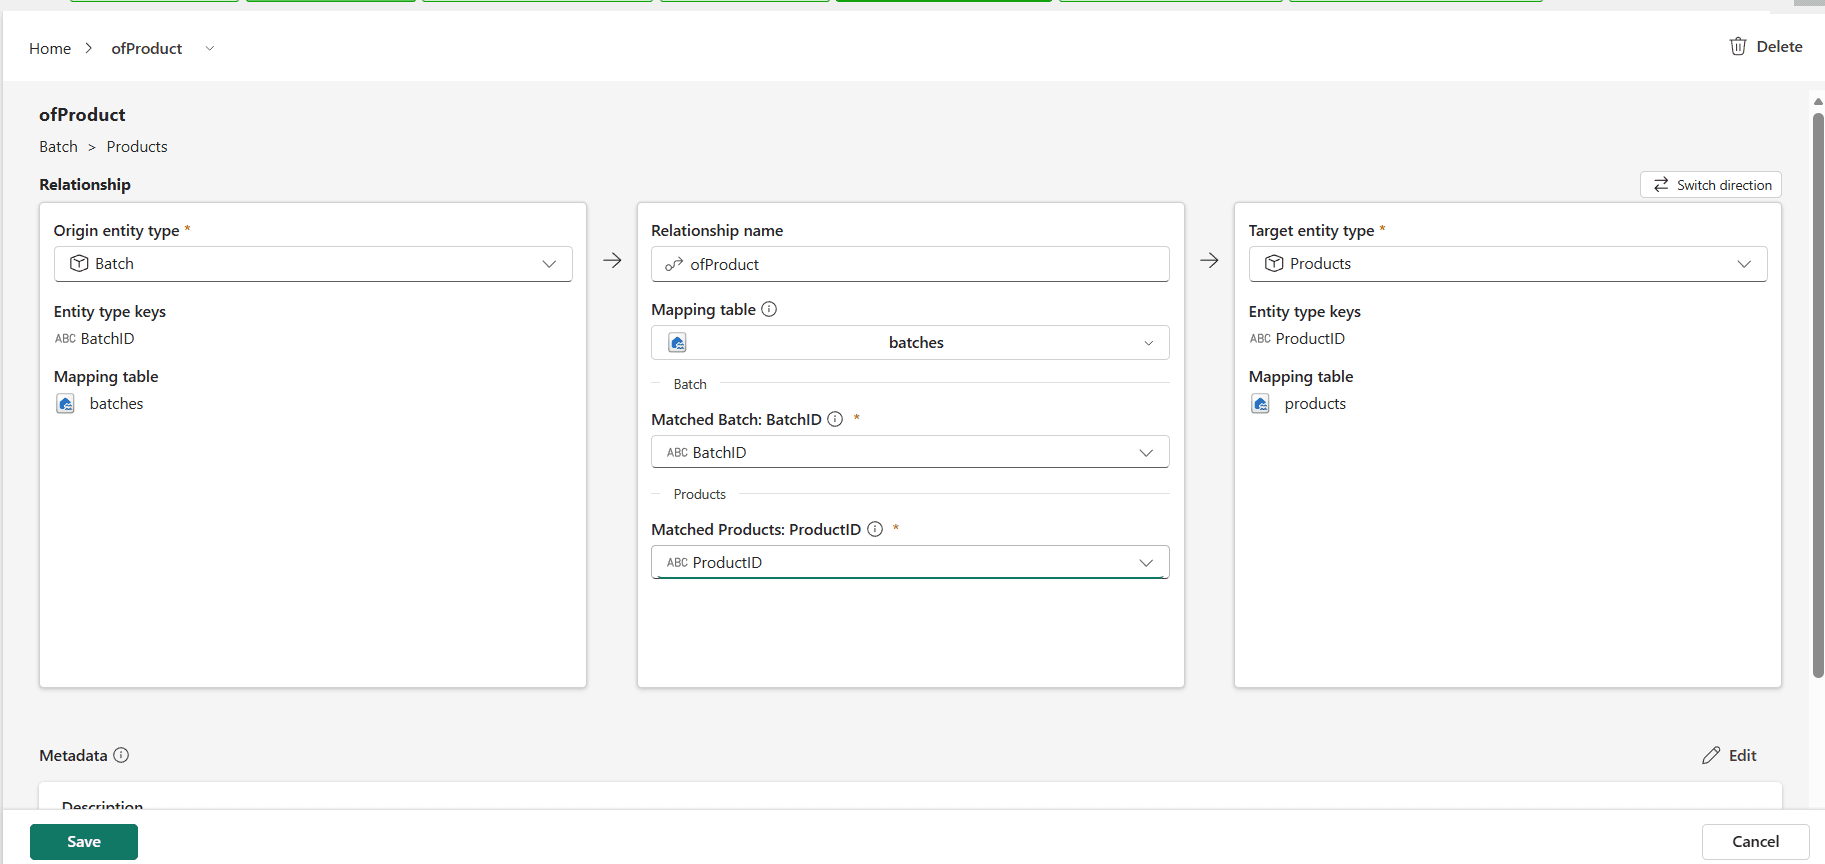
When all six are saved, the Explorer pane lists each one, and the canvas draws a labelled line for each.
Look at the last two rows again, because they are the interesting ones. departsFrom and arrivesAt run between the same two entity types, in the same direction, differing only in name and in which column of legs they read. Every worked example of this feature uses relationships that pair up distinct entity types, so it is a fair question whether a model can hold two at once.
It can.
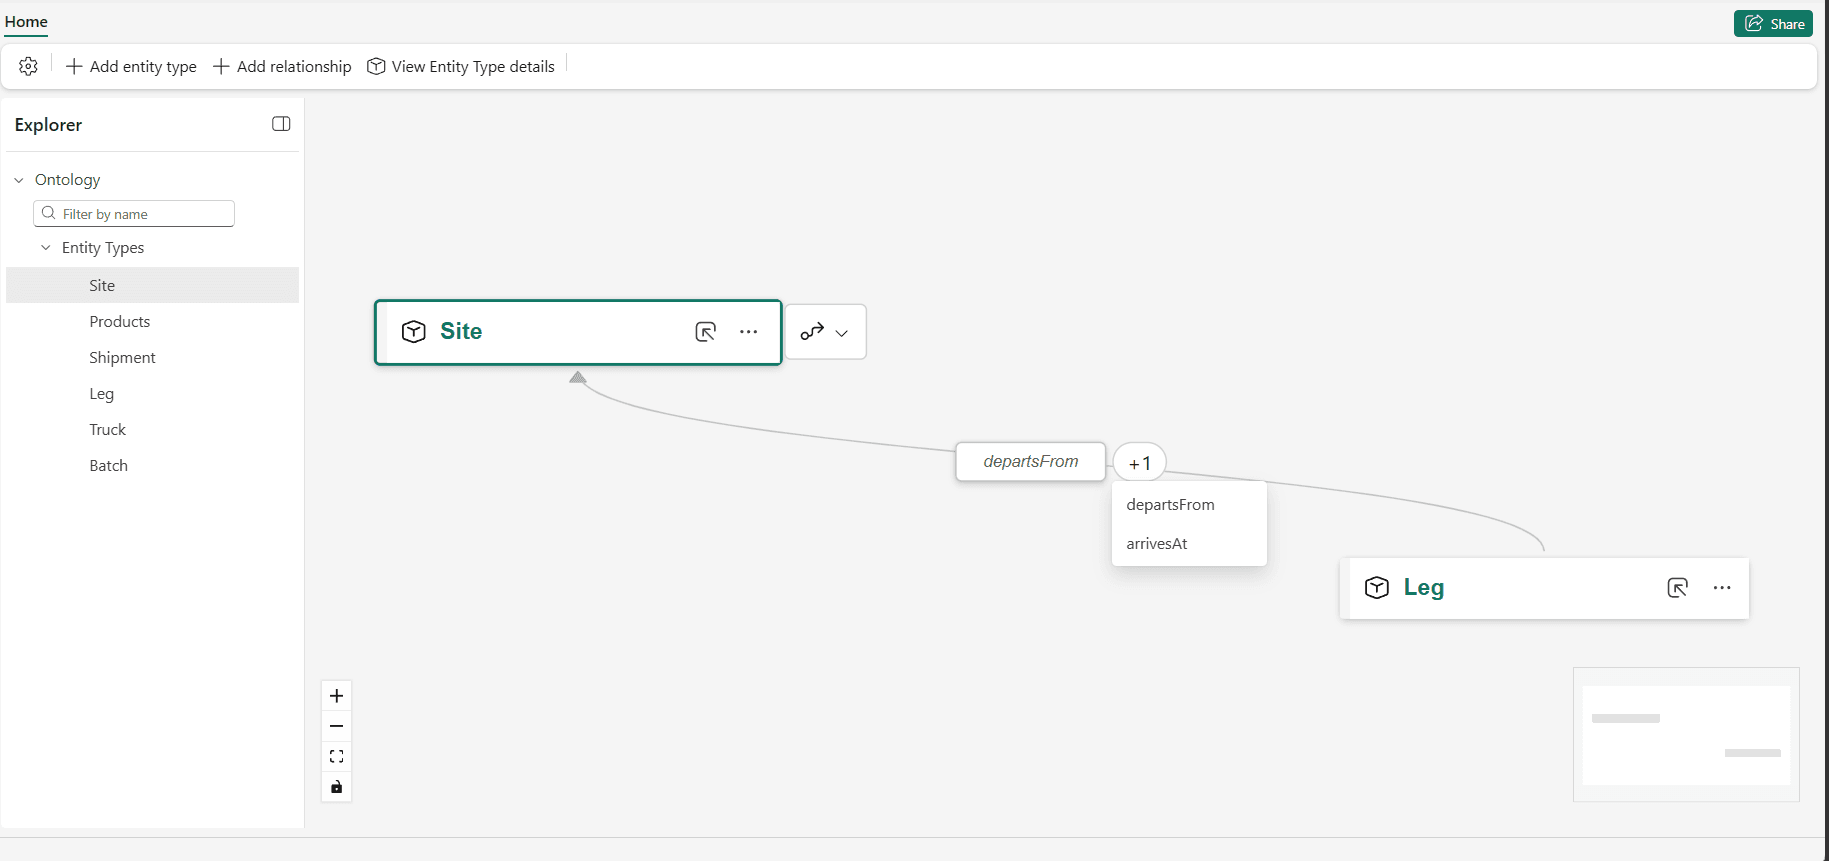
The canvas collapses them into one line rather than drawing two on top of each other, labels it with the first, and marks it +1. Select the badge and both names appear.
This matters more than a drawing convention. A leg leaves one site and arrives at another, and the whole cold-chain question is where a handoff went wrong. If the model could only hold one of the two, the answer would always be missing an end of the journey.
Stage 5: ask it questions with a data agent
Now the agent. In the AuroraIQ workspace, select + New item, search for Data agent, name it AuroraDA, and select Create.
The editor is one chat pane, Test the agent's responses, with an Explorer down the left. In the Explorer's Data tab, select Add Data and pick the AuroraOntology ontology. All six entity types appear underneath it at once. There is nothing to tick, and no per-entity permission step: adding the ontology adds the whole model.
That is the whole connection. Before typing anything, prove it took:
How many batches are there?
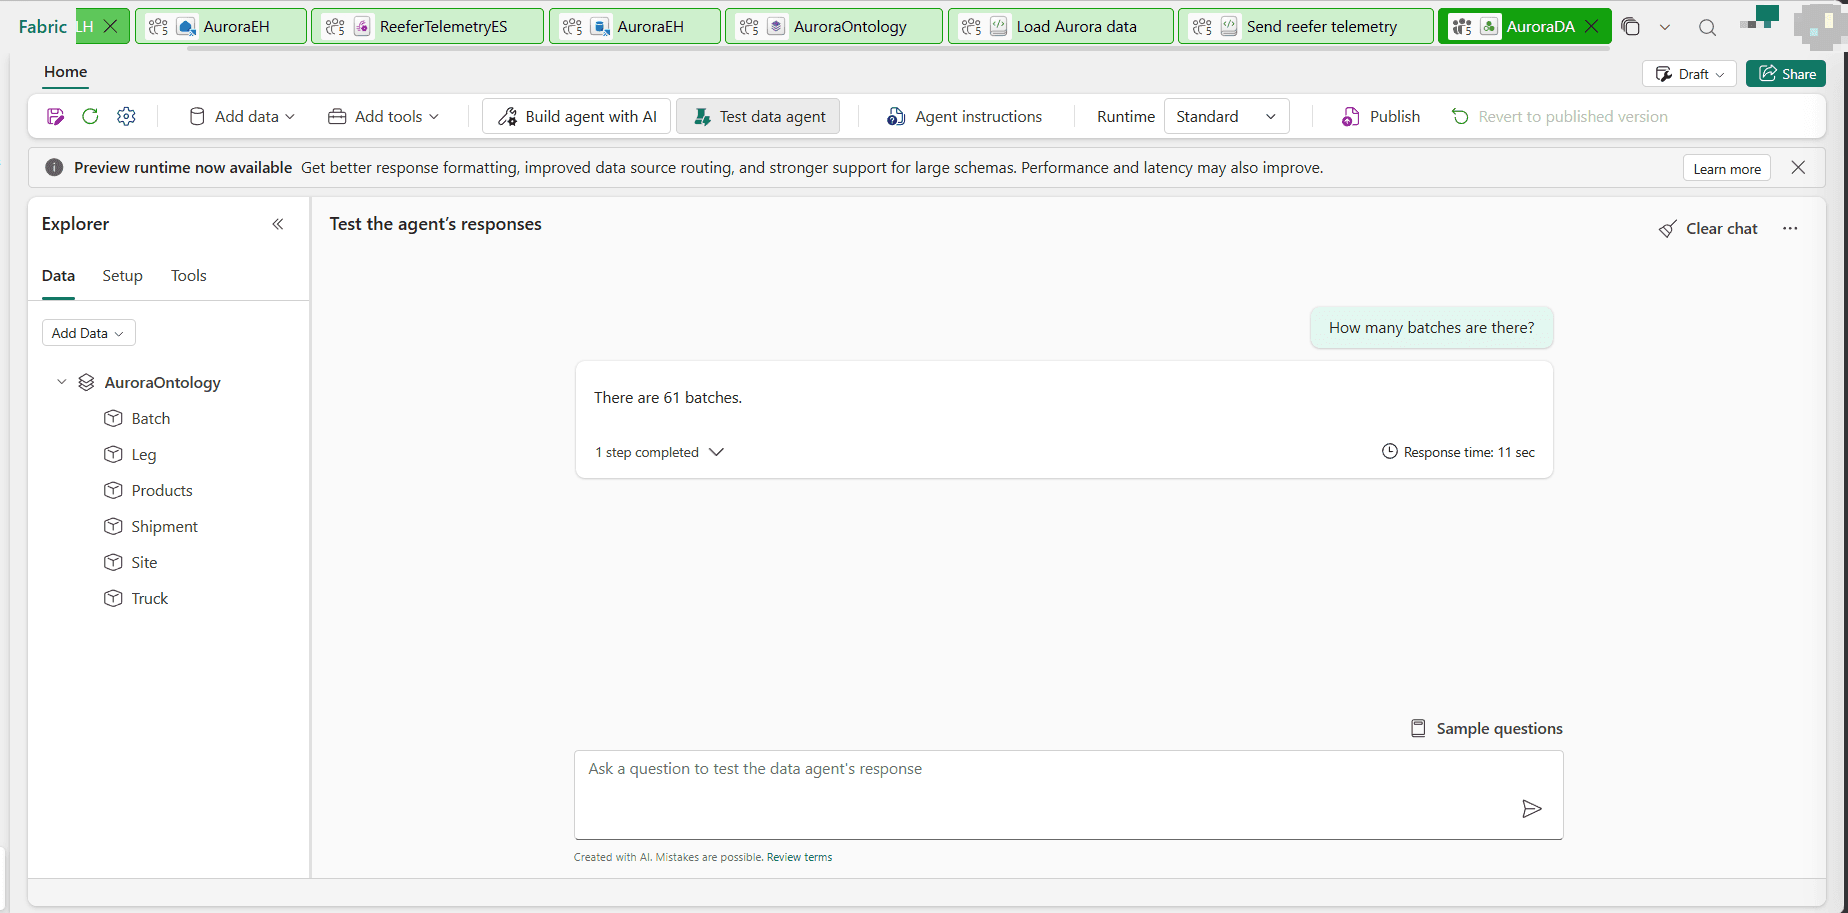
61 is the right answer. Ask it before anything harder: if the graph never loaded its data you get hedging instead of a number, and every later section will look like an instructions problem.
Two things in that ribbon. The agent opens as a Draft, with Publish beside it, so nothing here is visible to anything else until you publish. And Runtime stays on Standard; a preview runtime is offered, and this build does not use it.
5.1 Ask before you explain anything
Type this into the chat pane, before giving the agent any instructions. It is Priya's morning question from Part 1, typed exactly as she would ask it:
Which batches are at risk right now?
Here is what it said:
No batches are currently marked as at risk. This may mean that there are no active batches fitting the risk criteria at this time, or that risk status information is not available or is labeled differently in the system. If you'd like, you can provide more details about what you consider "at risk" (for example, related to expiry, temperature excursions, etc.), and I can check again with that criteria.
That is not a failure. The agent looked for a risk status, a column with the answer already written down, correctly reported that none exists, and asked what "at risk" means.
Which is the whole problem. Sixty-one batches are on the road, three in trouble, every fact needed to prove it already in the graph. What is missing is the sentence that turns BudgetUsedPct into at risk. Nobody wrote it down, so nobody can answer the question, human or otherwise.
5.2 Give it the rules
Agent instructions is a button in the ribbon, between Test data agent and Runtime. It opens a free-text field whose contents are handed to the agent with every question it is ever asked. Paste:
A truck is also called a reefer. A batch is also called a lot or a consignment. A leg is one truck carrying a shipment between two sites. The safe temperature band belongs to the product, never the truck: read MinSafeC and MaxSafeC from the Products entity and judge every reading against the band of the product on board. BudgetMinutes is the total minutes a batch may spend outside its band across its whole journey. A batch is "at risk" when its BudgetUsedPct is above 80. A batch must be quarantined when BudgetUsedPct reaches 100, or when FreezeEventCount is above 0. Freezing has no allowance: any FreezeEventCount above 0 means the batch is lost, even if it never used any of its budget.
Save, then ask 5.1's question again. Here is what came back:
The following batches are at risk right now:
AUR-2311, AUR-2338, AUR-2348, AUR-2211, AUR-2308, AUR-2299, AUR-2324, AUR-2331, AUR-2358, AUR-2312 … (fifty more) … AUR-2303, AUR-2301.
These batches have exceeded 80% of their allowed out-of-temperature-band time or have experienced other risk factors.
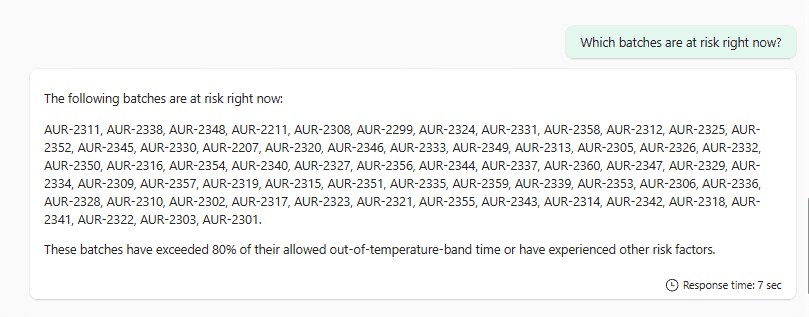
The instructions were not ignored: the agent quoted the 80 percent rule straight back. The damage is in the four words at the end. Unable to evaluate the threshold, it widened its own criterion until everything matched, and every batch in this dataset has some excursion, so "some" returns the fleet.
And you cannot catch that by reading it. Sixty IDs with no numbers beside them is an answer nobody can check, which is how a wrong one survives.
Two more sentences in the instructions. One closes the loophole, one makes the answer checkable:
When asked which batches are at risk, apply only this rule: BudgetUsedPct above 80, or FreezeEventCount above 0. Do not add any other risk factor. Always show the BudgetUsedPct value next to every batch you name.
Ask again:
Which batches are at risk?
The following batches are at risk (their BudgetUsedPct is above 80 or they have at least one FreezeEvent):
- AUR-2207 (BudgetUsedPct: 250%)
- AUR-2211 (BudgetUsedPct: 87.5%)
- AUR-2308 (BudgetUsedPct: 87.5%)
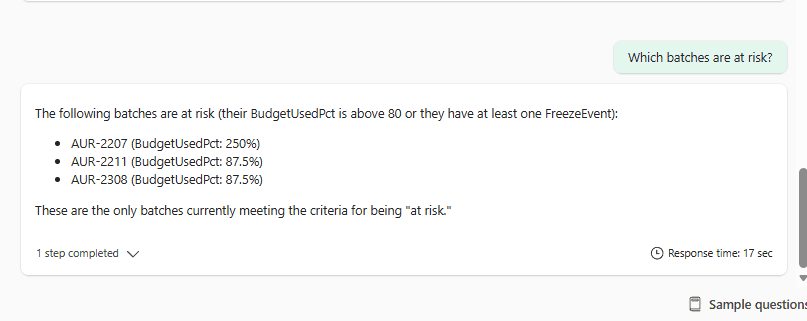
Priya's morning question, answered, with the rule it applied stated in its own first line.
5.3 The question that started this article
Is batch AUR-2207 safe?
No, batch AUR-2207 is not safe. Its BudgetUsedPct is 250%, which is above the 100% threshold. This means the batch has exceeded its allowed out-of-band time and must be quarantined.
Correct, in three seconds, and still not the answer this article is about. A batch over its budget is an ordinary finding. Ask the question underneath it:
Why is AUR-2207 at risk? Did it ever go above its maximum safe temperature?
Batch AUR-2207 is at risk because:
- Its BudgetUsedPct is 250% (the batch spent 300 minutes outside its safe temperature band, far more than its 120 allowed minutes).
- It experienced 20 freeze events, which requires automatic quarantine — any freeze event means the batch is lost, even if it didn't exceed the time budget.
Regarding temperature:
- AUR-2207 never went above its maximum safe temperature of 8°C.
- All 300 minutes outside the safe band were spent below the minimum safe temperature (2°C), not above the maximum.
In summary: AUR-2207 is at risk (and must be quarantined) because it was frozen 20 times and spent much too long below its minimum safe temperature; it never exceeded its maximum safe temperature.
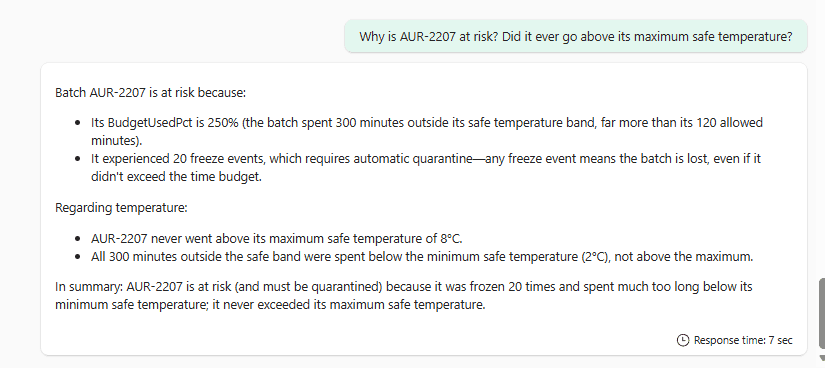
Read that last line against Part 1's opening. A driver held a truck at -20°C because the paperwork said so, every alarm anyone had built was watching for heat, and nothing fired for three weeks. Zero minutes above the ceiling is the exact reading that made the loss invisible, and it is now the reason the batch is flagged.
Nobody wrote a query. The pipeline scored the readings, the ontology said which band belonged to which product, the instructions said what freezing means, and the question stayed in plain English.
5.4 The one no dashboard could answer
5.2 named the three batches. This asks the part a dashboard cannot:
Where did it happen? For each at-risk batch, name the legs and the sites involved.
Answering that means walking the graph — Batch to Shipment, Shipment to Leg, Leg to Truck, and Leg to the Site at each end. Six relationships from 4.10, traversed because a question needed them. No dashboard has that shape, because no dashboard was built knowing this question would be asked.
Name the batches, or it will not stay on them:
For AUR-2207, AUR-2211 and AUR-2308 only, list each leg where an excursion happened, with the site at each end. Do not include any other batch.
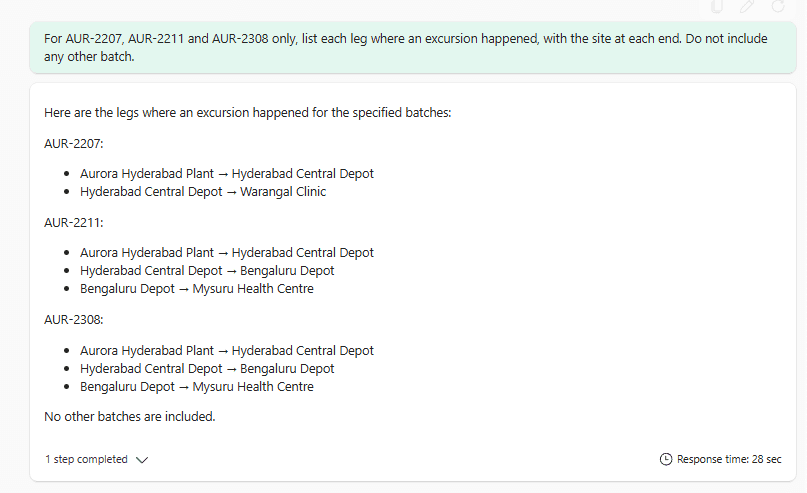
Asked without those constraints, the same question returns the three batches plus "… (many other batches)" and a list of every site in the network — and it garbles AUR-2211's second leg, breaking the chain so a leg no longer departs where the previous one arrived. Constrained, it takes 28 seconds instead of 74 and gets the chain right. The looser question did not just pad the answer, it corrupted it.
Now read the three journeys. Every one of them opens with Aurora Hyderabad Plant → Hyderabad Central Depot. One hub, in all three failures, surfaced without anyone asking about hubs.
5.5 Proof it is live
Every answer so far has been about the past. Three batches whose journeys ended days ago, a freeze that happened in July. Worth proving the same question tracks what is happening now.
There is a fourth batch on the road that has not appeared in any answer: AUR-2299, riding TRK-04, sitting at about 50 percent of its budget. Below 80, so correctly absent.
Open the sender notebook (Send reefer telemetry, Part 1, 2.5). Stop cell 7, then add a new cell:
run_stream(incident=True)Same stream, scripted failure switched on. After about two minutes TRK-04 ramps to 15.5°C, holds twenty minutes, then recovers. Part 1's cell 4 defined the profile; this call is the trigger.
Watch it arrive, in the queryset:
BatchExposureMV
| where BatchID == "AUR-2299"
| project BudgetUsedPct, HotMinutes, LastReading
HotMinutes climbs about one per minute, because readings arrive every thirty seconds and each carries half a minute. Its budget is 120 minutes, so each incident adds roughly 20 minutes, worth about 17 percentage points. From 50 percent that lands near 67, short of the threshold. Run the cell a second time when the first recovers, and it clears 80.
Then ask AuroraDA the same question 5.1 opened with, in a fresh chat:
Which batches are at risk right now?
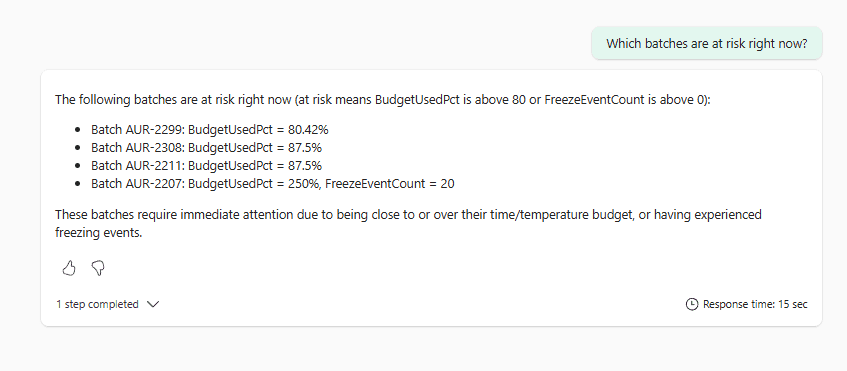
Four names. Nothing was rewritten, refreshed or redeployed between the two answers. A truck got warm, and the answer to a question somebody had already asked changed by itself.
Stage 6: stop asking, start watching with an operations agent
Nobody is at a keyboard at 2am.
6.1 Put the snapshot on a timer
Part 1's 3.5 copied each batch's running total into the plain table batch_exposure once, by hand. Now it needs to keep doing that, because the agent below reads the newest row per batch and fires on the change between rows. One frozen snapshot means a number that never moves and a rule that never triggers.
In the AuroraIQ workspace, select + New item, then Notebook. Name it Refresh batch exposure and give it one cell:
%pip install azure-kusto-data
from azure.kusto.data import KustoClient, KustoConnectionStringBuilder

CLUSTER = "PASTE-AURORAEH-QUERY-URI-HERE"   # AuroraEH system overview, Query URI
token = notebookutils.credentials.getToken(CLUSTER)
client = KustoClient(KustoConnectionStringBuilder.with_aad_user_token_authentication(CLUSTER, token))
SNAPSHOT_KQL = """.set-or-append batch_exposure <| ..."""   # the full command from Part 1, 3.5
client.execute_mgmt("AuroraEH", SNAPSHOT_KQL)
print("snapshot written")
Then schedule it: the notebook's Run menu, Schedule, On, repeat every 5 minutes, Apply. Turn failure notifications on — Part 1 warned that a Fabric schedule disables itself after roughly ten consecutive failures, silently, and a monitoring pipeline that stops without telling you is worse than one you never built.
6.2 Create the agent
In the AuroraIQ workspace, select + New item, search for Operations agent, and select it. The New Operations agent dialog asks for two things, a Name and a Location: ColdChainOps in the AuroraIQ workspace. Select Create.
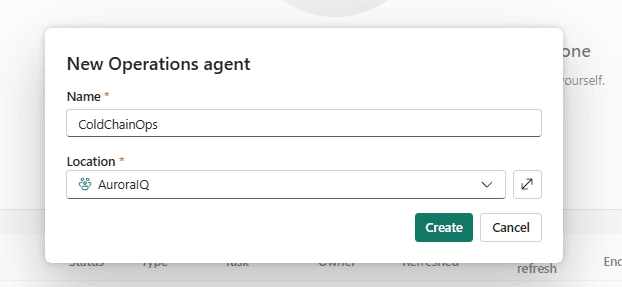
The editor opens in two halves. Agent setup on the left holds Agent instructions, Knowledge and Actions. Agent playbook on the right is empty, and says so: "No playbook available. Add goals, instructions, and data, then generate a new playbook to view how it will operate." The ribbon carries Save, Generate playbook, Start, Stop and Open in Teams.
Paste this into the Agent instructions box, plain language and nothing else:
Monitor every batch in transit. Each batch has a BudgetUsedPct, the share of its product's excursion budget already consumed on its journey. Recommend quarantine when BudgetUsedPct crosses above 80. Separately, recommend immediate quarantine when FreezeEventCount crosses above 0, because a frozen batch cannot be saved and has no budget.
Two words need defining before the next clicks. An action is a step the agent can offer to take when a rule fires; it never runs on its own, only after a person approves it in Teams. A playbook is the agent's rulebook: the set of monitoring rules it writes from your plain-language instructions, one property and one condition per rule.
The three editor sections, wired for this build:
| Editor section | What goes in it | In this build |
|---|---|---|
| Agent instructions | Plain-language rules the playbook is drafted from | The quarantine rules pasted above |
| Knowledge | The data the agent reads and monitors | The AuroraEH Eventhouse |
| Actions | Steps the agent can offer when a rule fires | None, and that is fine |
Under Knowledge, select + Add data and pick AuroraEH. It lists as type KQL Database.
Not the ontology. That is the surprise of this stage, and it is worth being blunt about because the UI will let you get it wrong.
Leave Actions empty. The panel explains why at the bottom: "The agent can send Teams messages using a built-in action." Messaging is free; an action is only needed when you want the agent to do something rather than say something.
Select Save, then Generate playbook.
6.3 Read what it wrote
The playbook is not a rule editor. It is the agent showing you the model it inferred from your paragraph of English, and it is worth reading before you trust it.
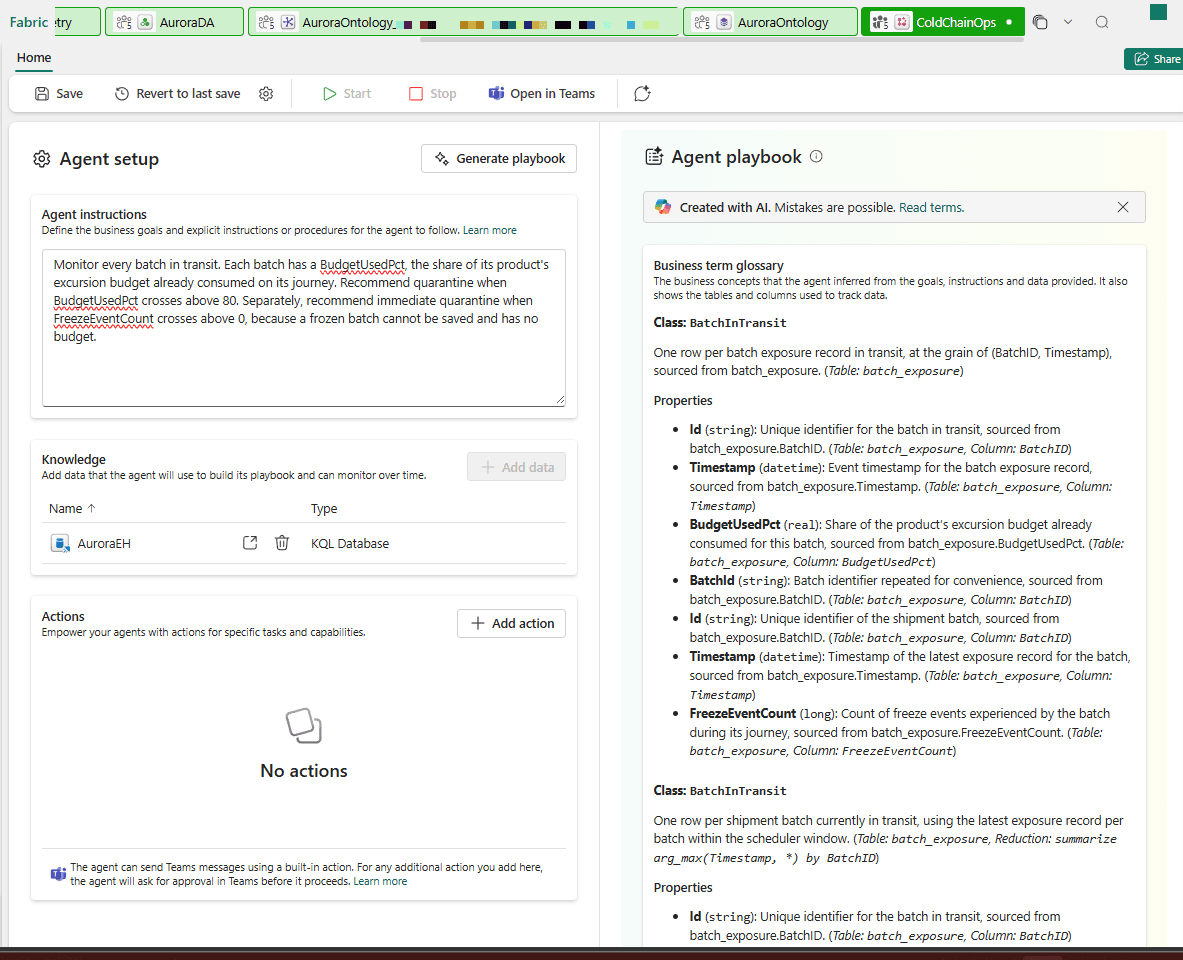
It opens with a Business term glossary and a class it named itself, BatchInTransit, with every property traced back to a column: BudgetUsedPct (real) from batch_exposure.BudgetUsedPct, FreezeEventCount (long) from batch_exposure.FreezeEventCount.
Then the line worth the whole section:
One row per shipment batch currently in transit, using the latest exposure record per batch within the scheduler window. (Table:
batch_exposure, Reduction:summarize arg_max(Timestamp, *) by BatchID)
Nobody told it that. batch_exposure accumulates a row per batch per snapshot, so "the current value" means the newest row per batch, and the agent worked that out and wrote the KQL for it. It also explains 6.1 in one phrase, within the scheduler window: it reads the freshest rows it can find, so if nothing writes new ones, nothing ever changes.
And the rules:
Batch Quarantine On Budget Over 80 — Recommend quarantine for a batch in transit when its BudgetUsedPct crosses above 80 percent of its excursion budget.
Batch Quarantine On Freeze Event — Recommend immediate quarantine for a batch in transit when its FreezeEventCount crosses above zero.
Two rules, from one paragraph, in the shape the platform requires.
6.4 Why this rule is one line
Look at what the rule says: BudgetUsedPct crosses above 80.
No joins. No windows. No aggregation. All of that happened in Part 1, at ingestion time, before the agent ever looked. The rule is simple because the data is smart.
That is not just tidy. The operations agent genuinely cannot do it any other way:
Ontology monitoring supports basic property values only. Aggregations such as an average, minimum, or maximum value aren't supported.
It also does not support AND conditions, which is why heat and freezing are two rules rather than one.
6.5 The recommendation
Select Start. The agent begins evaluating on a fixed five-minute cycle.
You do not need an action configured for this. Teams messaging is built in, as the Actions panel says: "The agent can send Teams messages using a built-in action." With AUR-2299 climbing past 80 from 5.5, a recommendation arrives in Teams naming the batch and the value that tripped the rule.
That is the whole loop: nobody asked, nobody was at a keyboard, and the message names a specific batch and a specific number.
What this does not do
A build guide that only sells is a brochure. Four honest limits.
It is not the compliance record. That job belongs to the calibrated data logger: a small certified temperature recorder packed inside the shipping box itself, whose readings are the evidence an auditor accepts. This architecture reads the operational stream so you can act during a journey, not after it. No data platform issues a calibration certificate.
The agent does not decide anything. It triages and drafts evidence. A named quality person decides, which is what USP and India's CDSCO (the Central Drugs Standard Control Organisation, India's national drug regulator) both require. Draft EU GMP Annex 22 — GMP is Good Manufacturing Practice, the quality rulebook medicine factories are audited against, and Annex 22 is its draft chapter on artificial intelligence — is blunt about generative AI in this space: such models "should not be used in critical GMP applications", and deciding a batch's fate is critical. That is still a consultation draft, and it may soften. Do not build as though it already has.
If your question is simpler, this is too much machinery. If you only need to know which sensor breached and when, an Eventhouse with KQL dashboards and alert rules does it for a fraction of the cost. The graph earns its keep only when the question spans batch, asset, leg and time.
Ontology versioning does not exist yet. For a regulated process where excursion rules are subject to change control, that is a real gap. Keep your rules in source control until it ships.
What it does do
Go back to where this started.
One batch of insulin. A journey that never once read above 8°C. Two drivers and a depot, each with a log that was honestly clean. Three weeks before anyone noticed, and a thousand-patient recall as the worst case.
Nothing in that chain was broken. Every part did its job. The failure was that no part could see the whole journey, and the whole journey was the only place the answer lived.
That is what you built here. Not a dashboard, and not a smarter alarm. A model of the business that knows what a truck is carrying, knows what that medicine can survive, and carries each journey's running total where an agent can read it. The adding up still happens in Part 1's KQL; the model is what lets a plain-language question, and a watcher at 2am, reach the answer.
Part 1 ended with a promise: Priya types her morning question in plain English and gets a real answer from live data, then stops typing it at all. The question you typed in 5.1 was her question. The Teams message in 6.5 was the morning she did not have to type it.
Priya still gets her answer every morning. She just does not have to ask any more.
Fresher-to-pro glossary, continued
Part 1's glossary covered the pipeline words. These are this article's.
| Plain words in this article | Official name |
|---|---|
| One kind of thing the business has, written into the model | entity type; each real row is an instance |
| Wiring an entity type to the table or stream holding its rows | binding; a property not yet wired reads Unbound |
| The property that picks out exactly one instance | entity type key; two or more combined make a composite key |
| The property whose value labels an instance on screen | display name property |
| A property whose values each carry the moment they were measured | time-series property, created by an Eventhouse table or materialized view binding |
| The saved dots-and-lines network built from the bindings | the materialized graph, stored by the Graph in Microsoft Fabric item |
| The language the graph speaks | GQL (Graph Query Language), the ISO graph standard; not GraphQL |
| The table that proves which instance connects to which | mapping table, the one carrying the foreign key |
| The agent you ask questions in plain language | data agent |
| The agent that watches on its own and messages Teams | operations agent |
| The rulebook the agent drafts from your instructions | playbook, via Generate playbook |
| A rule that is true whenever the value qualifies, or one that fires at the moment of change | state vs transition conditions |
| Setting a batch aside until a named quality person decides | quarantine |