fabric-iq
Generate a Fabric IQ ontology from a Power BI semantic model
A semantic model already knows how your tables connect. Fabric IQ can read that and hand you an ontology in one click. This walkthrough builds a hospital ontology that way, then does the four things the generator cannot do for you: the keys, the relationship bindings, the time-series binding, and the meaning.
There are two ways to build an ontology in Microsoft Fabric.
The first is by hand. You create each entity type, type in each property, define each key, draw each relationship, and bind every one of them to a column. This site has a full walkthrough of that path: eight entity types, eleven relationships, north of forty separate acts of clicking.
The second is one button.
If you already have a Power BI semantic model, Fabric IQ can read it and generate the ontology from it. Tables become entity types, columns become properties, and the relationships you drew become relationship types. It takes about ten seconds, and what it hands back is genuinely most of an ontology.
Most. Not all. The gap between "most" and "all" is the part nobody writes down, so that gap is what this article is about.
Why a semantic model can turn into an ontology
Both are the same kind of object: a declared layer over tables that already exist in OneLake, describing how those tables relate. Neither moves data.
So when you drew a line from departments.HospitalId to hospitals.HospitalId, you wrote down a business fact — a department belongs to a hospital. You wrote it for Power BI's benefit, but the fact isn't about reporting. The generator reads those already-written facts and restates them in ontology terms.
That tells you exactly what won't carry over: anything the semantic model never knew.
| What lives in the semantic model | What the ontology gets |
|---|---|
| A table | An entity type, named after the table |
| A column | A property, with its data type |
| A relationship, From table to To table | A relationship type, auto-named from_has_to |
| The To column of a many-to-one relationship | Usually a key on the To entity type |
| A time-series stream in an eventhouse | Nothing. The model never saw it |
| What a column means to the business | Nothing. No column carries meaning |
| Synonyms an agent should recognise | Nothing |
The first four rows are the time you save. The last three are your afternoon.
If the distinction is still fuzzy: a semantic model is built for aggregation, an ontology for traversal and identity. The semantic model vs ontology concept page pulls them apart properly.
What you're building
Microsoft's Lamna Healthcare sample, so you can check your screen against a known-good result. The original lab is the click path; this article is that plus the reasoning and the traps.
Every label below is what the product showed in a build run on 17 August 2026. Several have drifted from the lab's wording — its "Bindings tab", "Add data to entity type", "Binding type: Time series", "Source entity type" and "+ Add key" are all names the UI no longer uses. Where they disagree, follow this article and trust your screen.
Six tables describing one hospital:
- Hospitals, Departments, Rooms, Patients, VitalSignEquipment — static reference data, headed for a lakehouse
- VitalSignsReadings — timestamped measurements from those monitors, headed for an eventhouse
That split decides where each file goes and it runs through the whole build.
The finished ontology is a five-hop spine: a hospital contains departments, a department contains rooms, a patient is admitted to a room, a monitor is assigned to a patient, and that monitor emits readings. "Whose vitals are deteriorating, and which hospital are they in" is a walk along that spine.
Part 1: land the static data in a lakehouse
An ontology binds to tables, so the tables have to exist first. That's the only reason this comes before anything interesting.
1.1 Create the workspace
Open app.fabric.microsoft.com, select Workspaces → + New workspace, and name it LamnaHealthcareIQ.
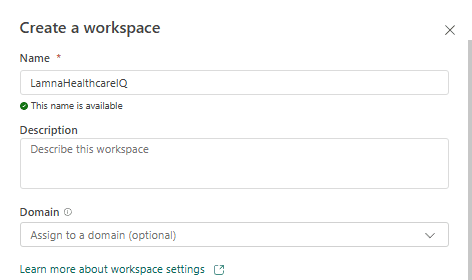
Open Advanced, set Workspace type to Fabric, Fabric Trial, or Power BI Premium, pick your capacity, and Apply. The plain Power BI options won't run an ontology.
1.2 Create the lakehouse
+ New item → search lakehouse → the plain Lakehouse card, not Sample lakehouse. Name it LamnaHealthcareLH, confirm Location reads LamnaHealthcareIQ, and Create.
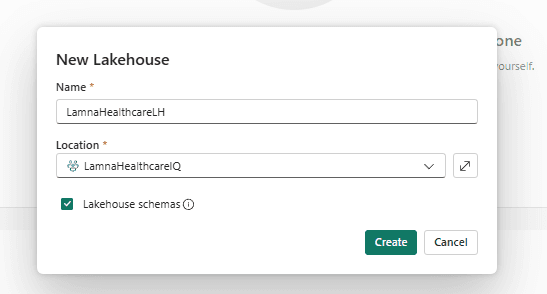
1.3 Upload five files, and deliberately not the sixth
Get the CSVs if you haven't: single ZIP or browse the folder. Extract them somewhere you can find them.
From the lakehouse's Get data screen, select Upload files and upload exactly these five:
Hospitals.csv, Departments.csv, Rooms.csv, Patients.csv, VitalSignEquipment.csv
Keep VitalSignsReadings.csv back for Part 2. Put it here instead and nothing errors, you just end up with a table of numbers rather than a monitor with a pulse.
Select Files in the Explorer and count five. The header reads Showing 5 items.
1.4 Load each file to a table
A CSV in Files is a file. The ontology can't bind to it. It needs a Delta table under Tables.
For each file: ellipsis (…) → Load to Tables → New table. In the Load file to new table dialog, leave Schema as dbo, accept the pre-filled New table name, check Use header for column names, leave Separator as a comma, and Load.
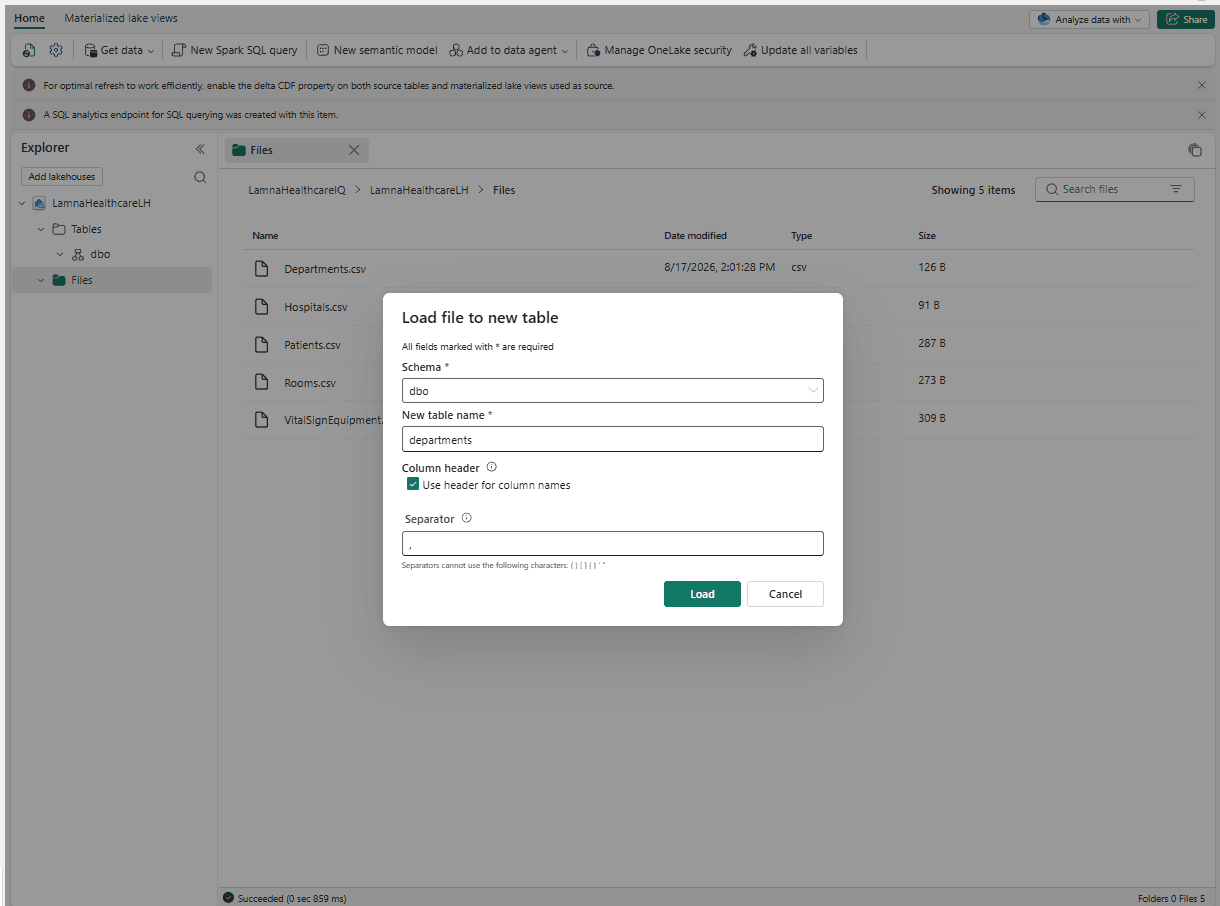
Five tables when you're done. Expand one and check the columns carry their headers, not _c0, _c1.
Part 2: land the readings in an eventhouse
Twenty rows, so this isn't about scale. It's about shape: readings in an eventhouse are what let Part 5.3 attach them to a monitor as a pulse.
2.1 Create the eventhouse
+ New item → Eventhouse, name it LamnaHealthcareEH, Create.
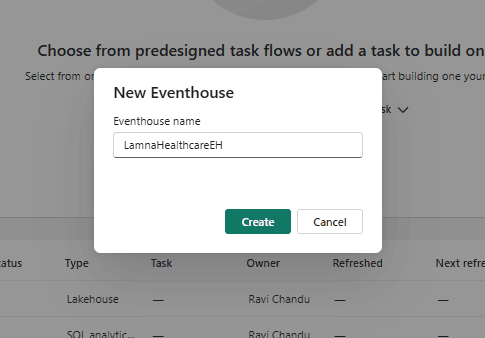
Fabric creates a KQL database with the same name inside it. Open that, and it reports This database is empty, which is what you'd hope.
2.2 Ingest the readings
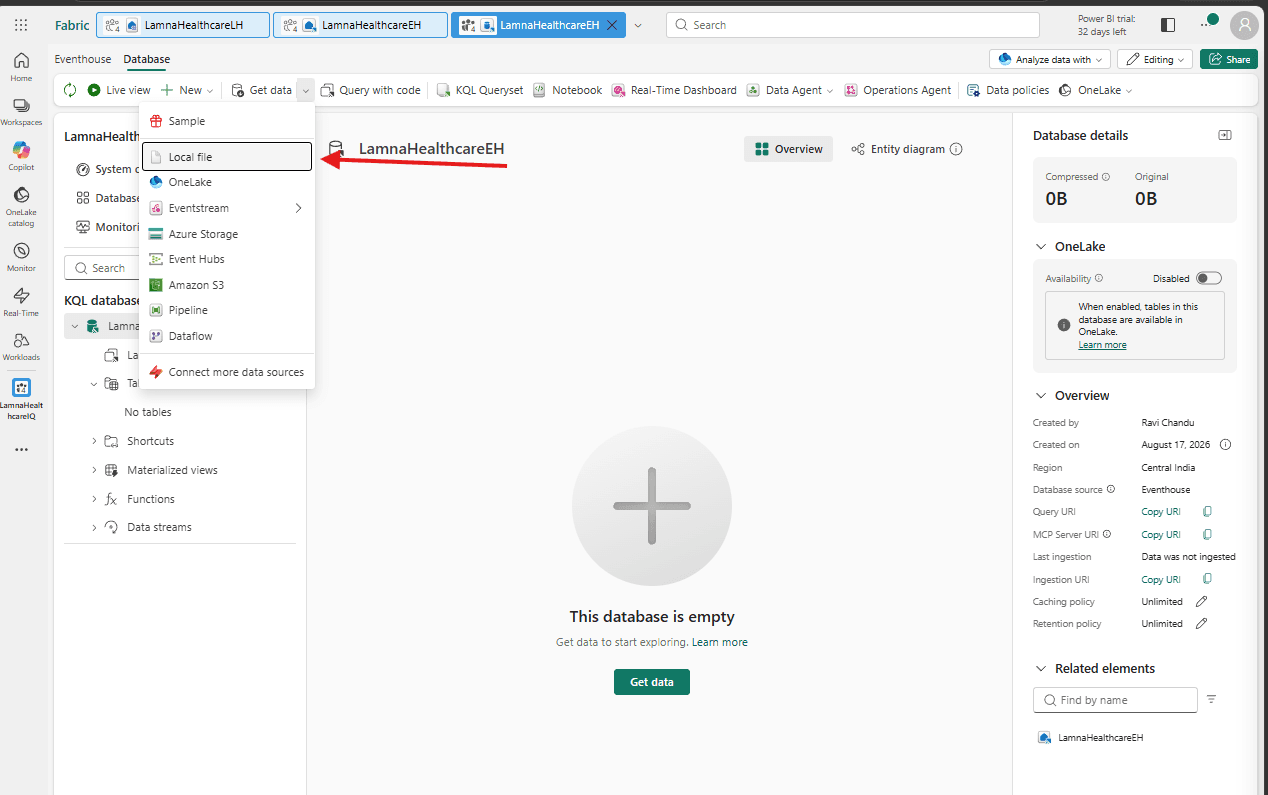
Select Get data → Local file.
The wizard runs in four stages: Source, Configure, Inspect, Summary.
Under Select or create a destination table, select the +, type VitalSignsReadings into the inline field, and confirm it with the tick. Then Browse for files on the right and pick VitalSignsReadings.csv.
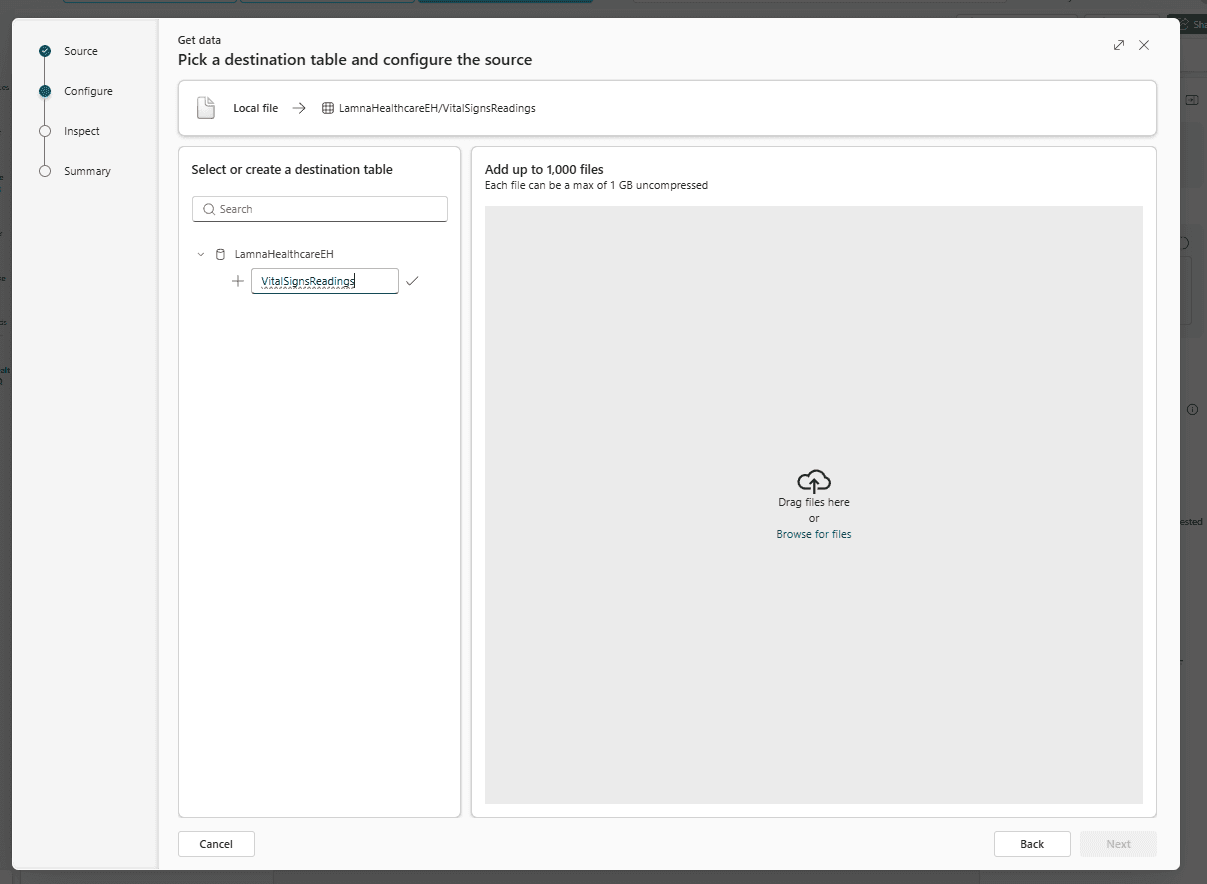
Next takes you to Inspect, which is the stage that matters. It shows the schema Fabric inferred, and you want Timestamp typed as a datetime rather than a string — Part 5.3 asks you to nominate a timestamp column, and a string won't qualify. Fix it here rather than after. Otherwise keep the defaults and Finish.
Confirm the table shows 20 rows.
Part 3: build the semantic model, and draw the four relationships
Everything here is the generator's input. Four lines drawn now are four relationship types you don't draw later. Draw them wrong and you generate a wrong ontology, then spend Part 5 wondering why the bindings misbehave.
3.1 Create the model
Open LamnaHealthcareLH and select New semantic model from the ribbon. Name it LamnaHealthcareModel, confirm Workspace reads LamnaHealthcareIQ, expand dbo, and tick all five tables. Confirm.
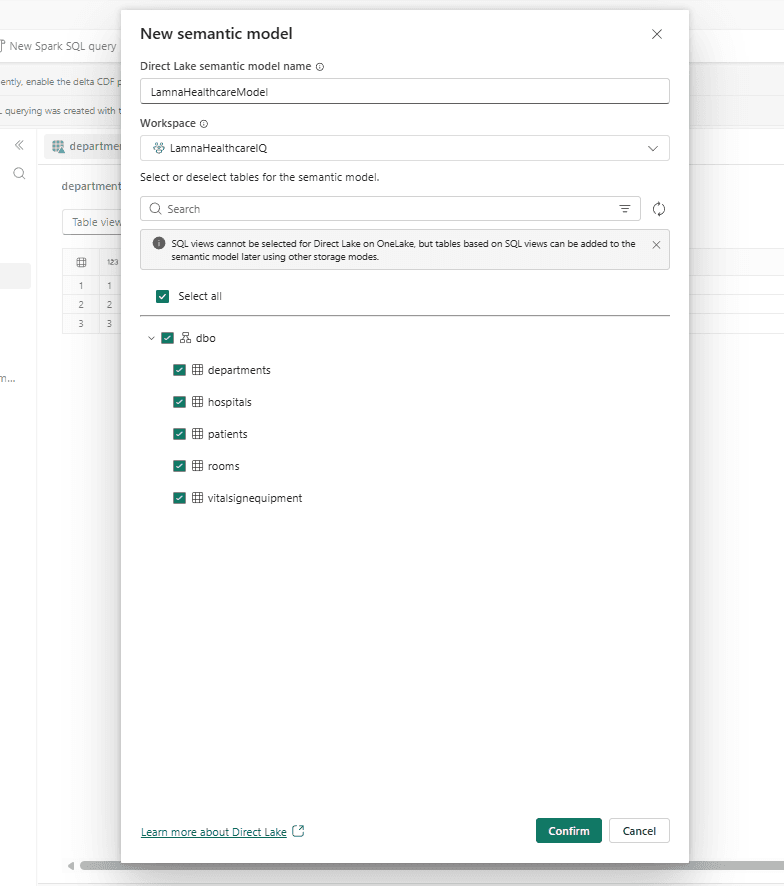
Confirm creates the model, but it doesn't drop you into it. Go to your workspace item list and select LamnaHealthcareModel to open the designer.
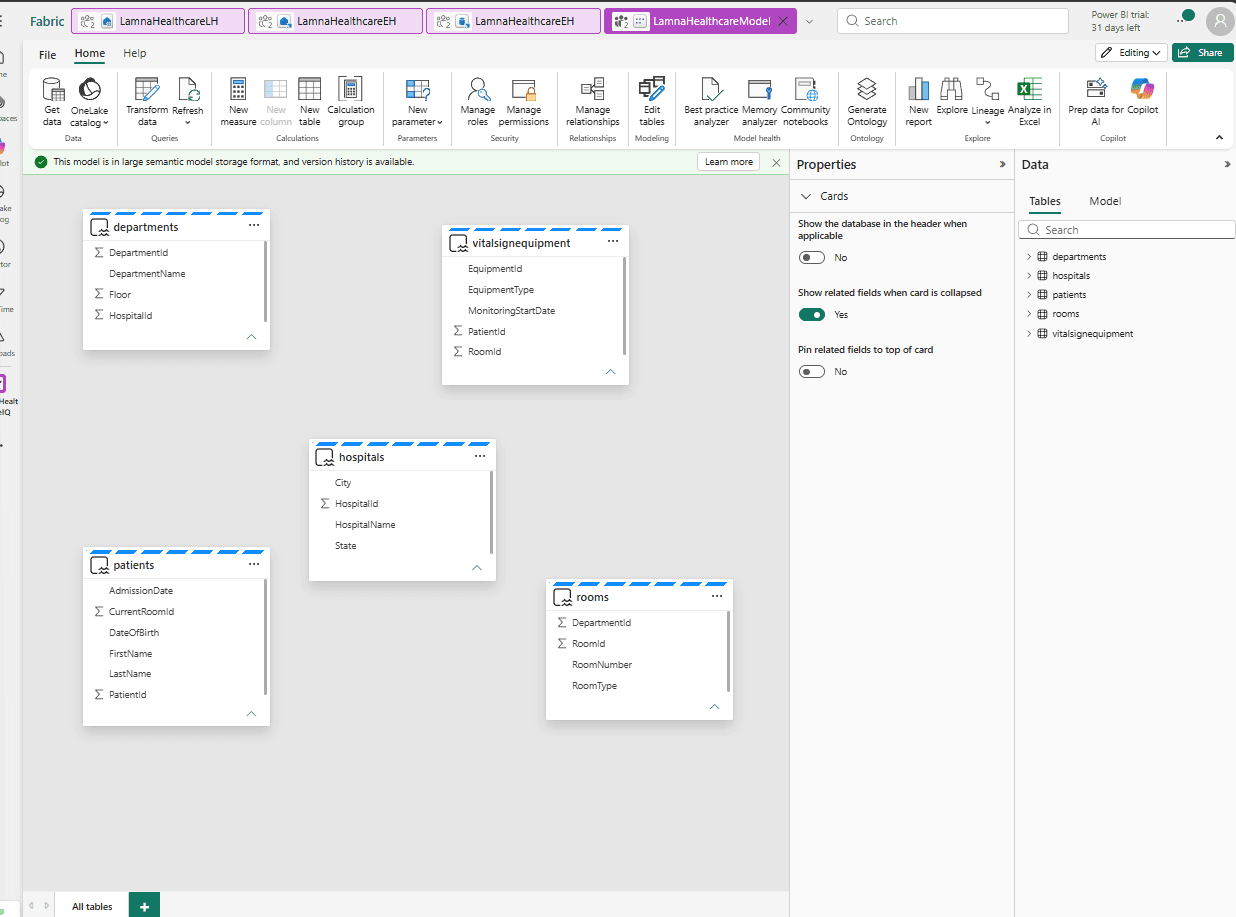
The Σ symbols mark columns Power BI has typed as numbers and will try to aggregate. EquipmentId doesn't carry one, because its values are strings like VS-1001, which is worth remembering when you reach the keys in 5.1.
3.2 Draw the four relationships
Manage relationships → + New relationship. All four use cardinality Many to one (*:1) and cross filter Both:
| From table | From column | To table | To column |
|---|---|---|---|
departments | HospitalId | hospitals | HospitalId |
rooms | DepartmentId | departments | DepartmentId |
patients | CurrentRoomId | rooms | RoomId |
vitalsignequipment | PatientId | patients | PatientId |
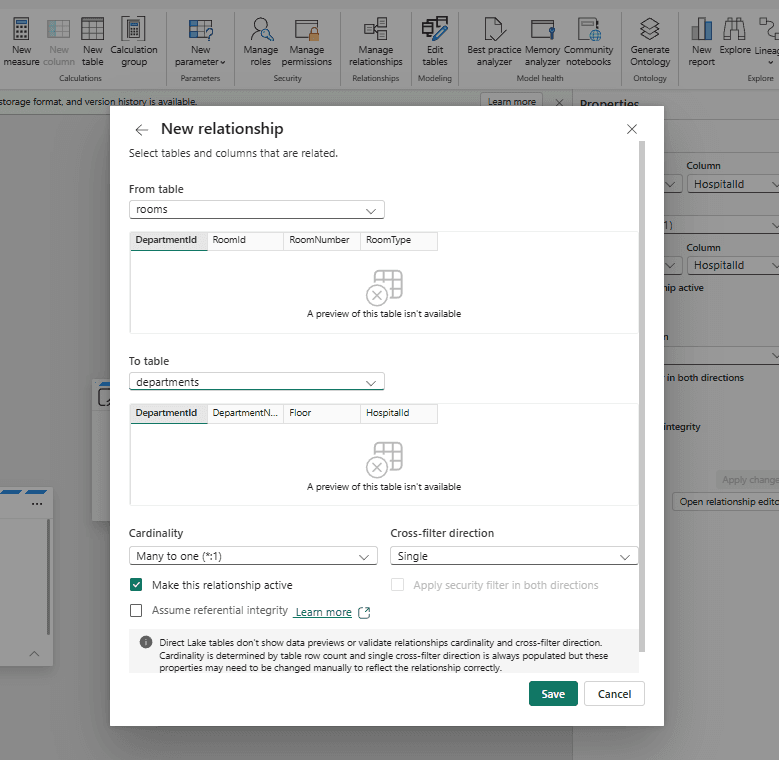
From is always the child, the many side, the table carrying the foreign key. To is always the parent. Get it backwards and Power BI still lets you save, but your ontology will claim a hospital belongs to a department and every traversal after that runs uphill.
Cross filter Both is a Power BI setting about filter propagation, and it matters for reports built on this model. It has no ontology equivalent — relationship direction there comes from the From-to-To pair, not from this setting.
3.3 Check before you generate
Open Manage relationships and confirm exactly four active relationships. Greyed-out rows are inactive, and duplicates appear if you saved a dialog twice. Either feeds the generator something you didn't mean.
The canvas is the faster check. Four lines, each with a * at the child end and a 1 at the parent end, and every table connected into one chain.
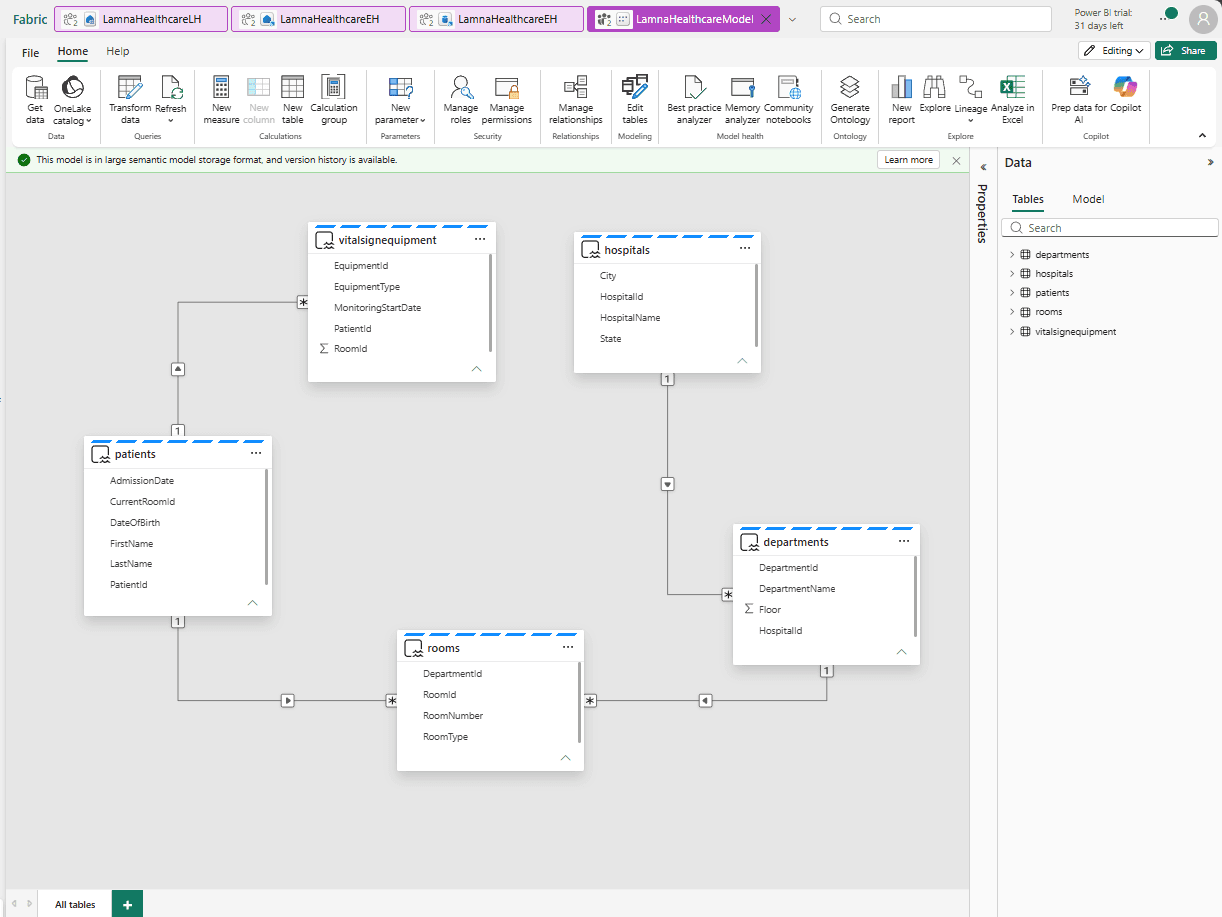
Read them back as sentences before you move on, because these become your ontology: a department belongs to a hospital, a room is part of a department, a patient is admitted to a room, a monitor is assigned to a patient.
Part 4: generate the ontology
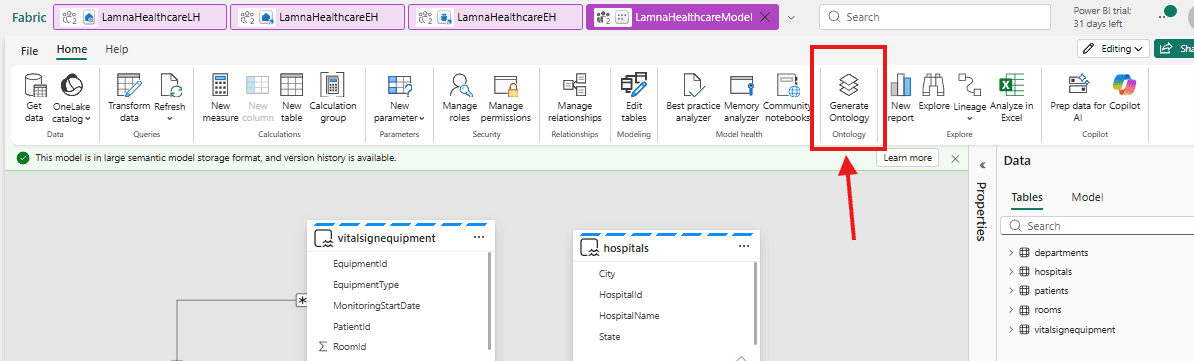
Generate Ontology sits in the model editor's ribbon under its own Ontology group, so if you're still in the designer from Part 3 you're already looking at it.
The lab has you close the model first and reopen it from the workspace with ellipsis (…) → Open semantic model. The button works either way, but reopening is cheap insurance that your four relationships were committed before the generator reads them.
Select Generate Ontology, pick LamnaHealthcareIQ from the workspace dropdown, name it LamnaHealthcareOntology, Create. Names take letters, numbers and underscores only.
What arrived
Five entity types carrying every column as a typed property: hospitals, departments, rooms, patients, vitalsignequipment.
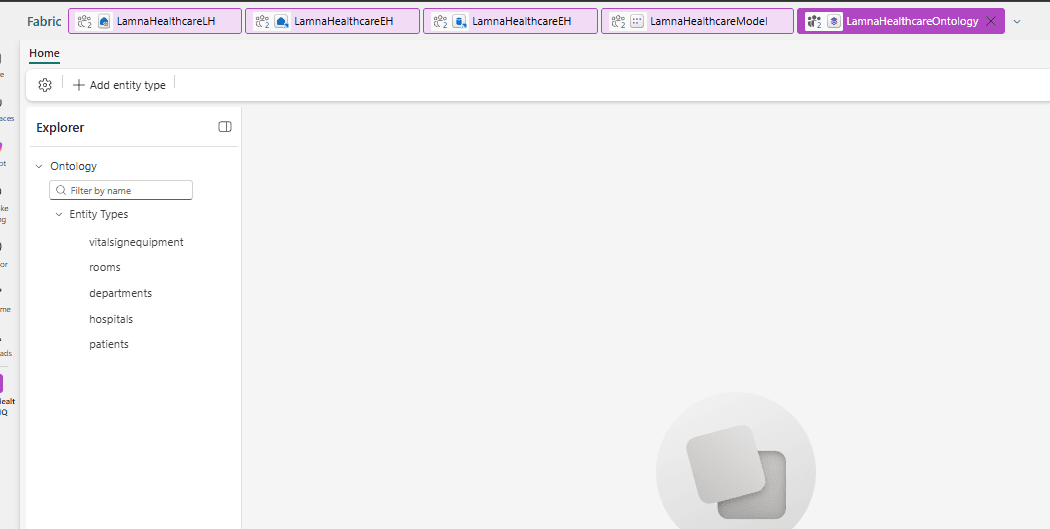
Four relationship types too, each auto-named from the pair you drew. Select an entity type and the canvas shows it with the relationships it takes part in, one at a time, rather than the whole model at once.
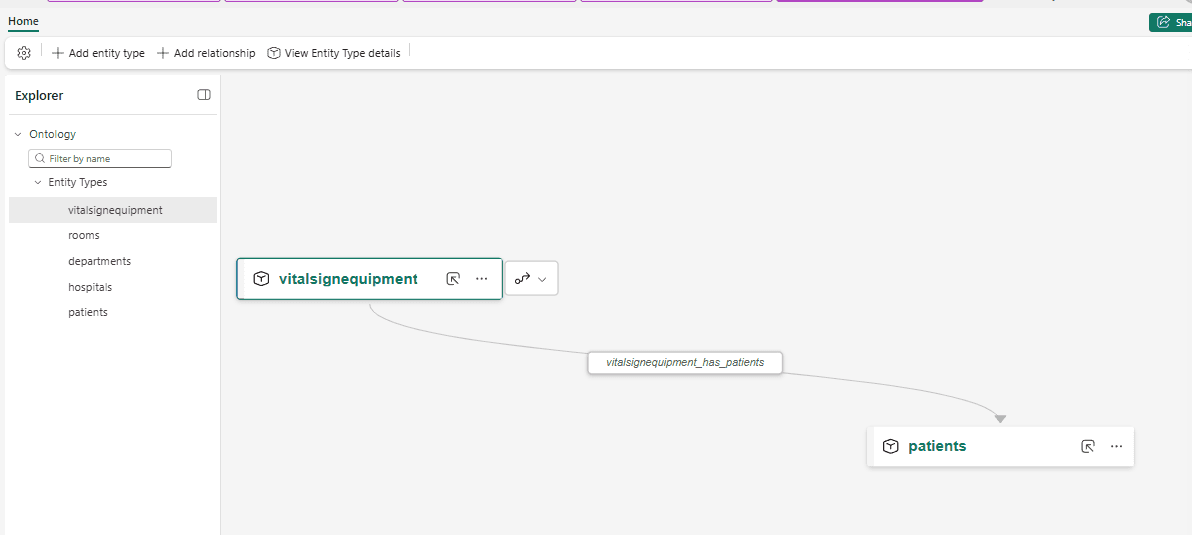
The other three read departments_has_hospitals, rooms_has_departments and patients_has_rooms.
And one thing the ribbon never mentions. Your workspace also gains a Graph in Microsoft Fabric child item, named after the ontology with _graph and a long identifier appended, so LamnaHealthcareOntology_graph_ followed by a string of letters and numbers.
It holds the materialized graph: the actual nodes and edges built from your bindings, and the thing agents and graph queries really run against. There is nothing to load into it until Part 5 binds your entity types to data, so leave it for now. Part 6 opens it as the last check.
By hand that would have been five entity creations, twenty-five property definitions, and four relationship dialogs. Then it stops, because four things remain that it structurally cannot do.
Part 5: finish the ontology by hand
The documentation compresses this into a sentence. It's the part that decides whether your ontology works.
Only 5.1 comes first is a real constraint, because every binding resolves against a key. After that 5.2 and 5.3 are independent, and doing relationships first is just a debugging convenience: it proves the static spine before streaming can confuse the result.
5.1 The keys, and the rule that predicts which are missing
A key is the property whose value picks out exactly one instance. Without it the graph can't tell two instances apart.
The official guidance says only that some keys are inferred and others need adding. The pattern behind it: a many-to-one relationship declares the To column unique. Many departments point at one hospital, so hospitals.HospitalId identifies a single hospital and the generator can promote it. Nothing makes that promise about a From column.
So look at which tables ever appear on the To side:
| Entity type | Ever a To table? | Key |
|---|---|---|
hospitals | Yes, from departments | HospitalId |
departments | Yes, from rooms | DepartmentId |
rooms | Yes, from patients | RoomId |
patients | Yes, from vitalsignequipment | PatientId |
vitalsignequipment | Never | EquipmentId |
vitalsignequipment sits at the end of the chain with nothing pointing at it, so it's the one most likely to arrive keyless. Check all five anyway.
Select an entity type to land on its Bind data to properties page. Under Entity type key, either the key is listed or you get Define entity type key — select that, pick the property from the Property list dropdown, and Save.
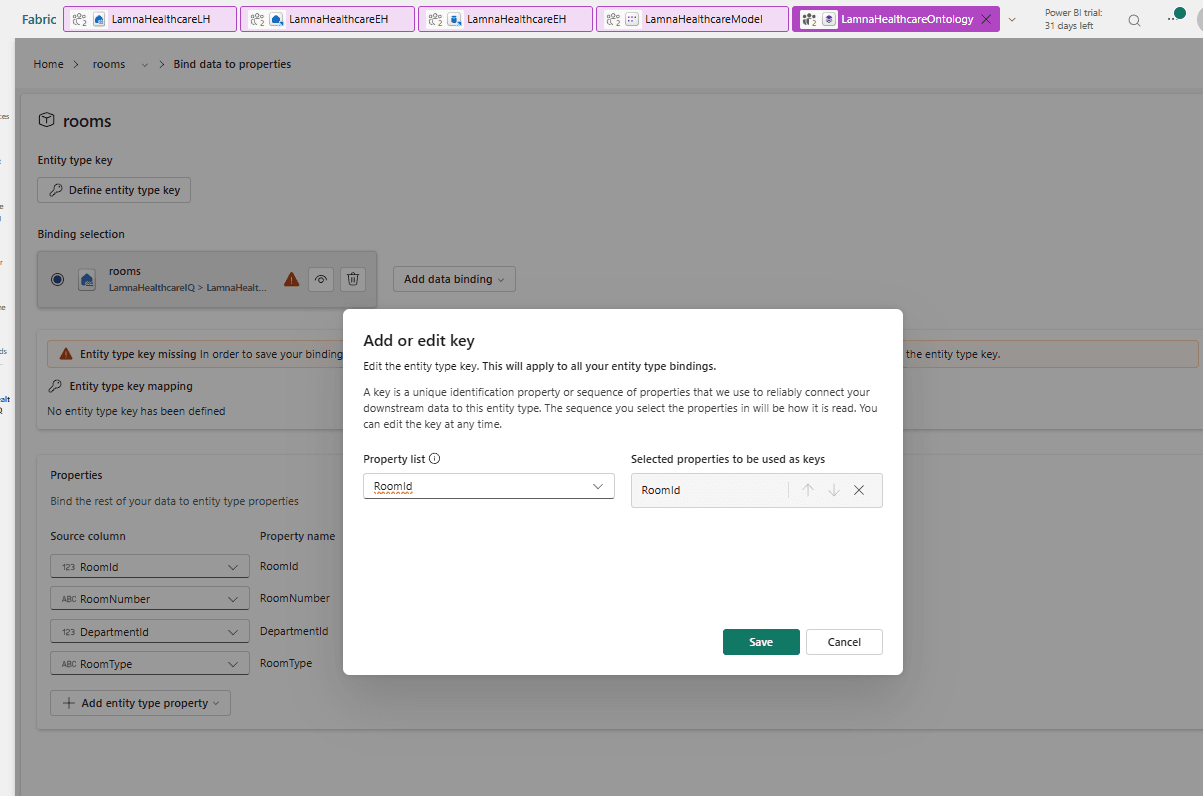
The dialog warns the key "will apply to all your entity type bindings", which is why keys come first, and the binding card refuses to save until one exists.
5.2 The relationship bindings, and the one table that can express each link
A relationship type says departments connect to hospitals. A binding proves which department connects to which, by pointing at a table holding both identifiers in the same row.
Bind to the child table. It's the only one that carries both columns.
departments carries a DepartmentId and a HospitalId on every row. hospitals has no column pointing back, because one hospital has many departments, so it physically cannot express the link. The foreign key lives on the many side, so the many side is the binding table — in any model, not just this one.
Select a relationship and you get three panels: Origin entity type and Target entity type read-only on the outside, and the wiring in the middle.
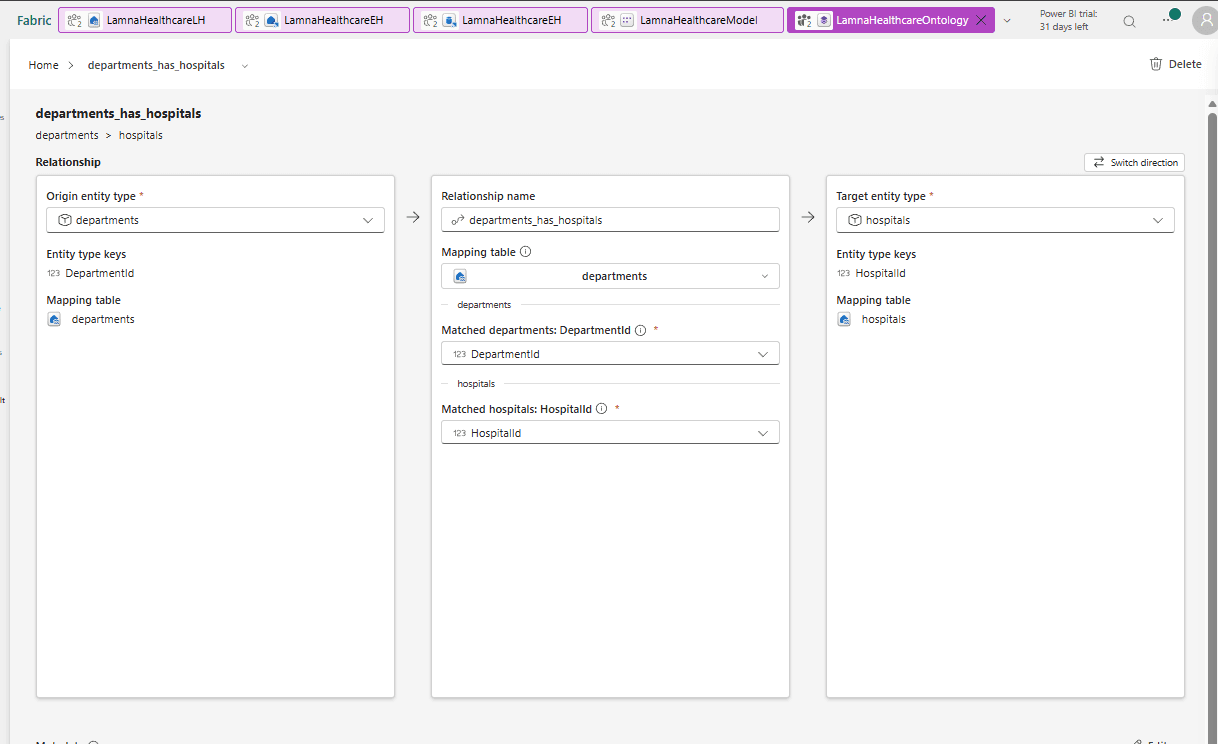
Pick the Mapping table, then answer its two questions: Matched <origin>: <key> and Matched <target>: <key>. Each asks which column in the mapping table carries that entity type's key.
| Relationship | Mapping table | Matched origin | Matched target |
|---|---|---|---|
departments_has_hospitals | departments | DepartmentId | HospitalId |
rooms_has_departments | rooms | RoomId | DepartmentId |
patients_has_rooms | patients | PatientId | CurrentRoomId |
vitalsignequipment_has_patients | vitalsignequipment | EquipmentId | PatientId |
A Switch direction button sits top right. If Part 4 handed you a reversed relationship, try that before adding a replacement and deleting the original — check the name afterwards, since it may keep the old one.
5.3 The time-series binding, or how one entity type gets two data sources
This is the thing an ontology does that a semantic model cannot, and the reason the build bothered with an eventhouse. vitalsignequipment knows only static facts so far: which monitor, on which patient, since when. A second binding points the same entity type at a different Fabric item carrying a different shape of data, so afterwards it reads both at once — the lakehouse for what a monitor is, the eventhouse for what it's measuring.
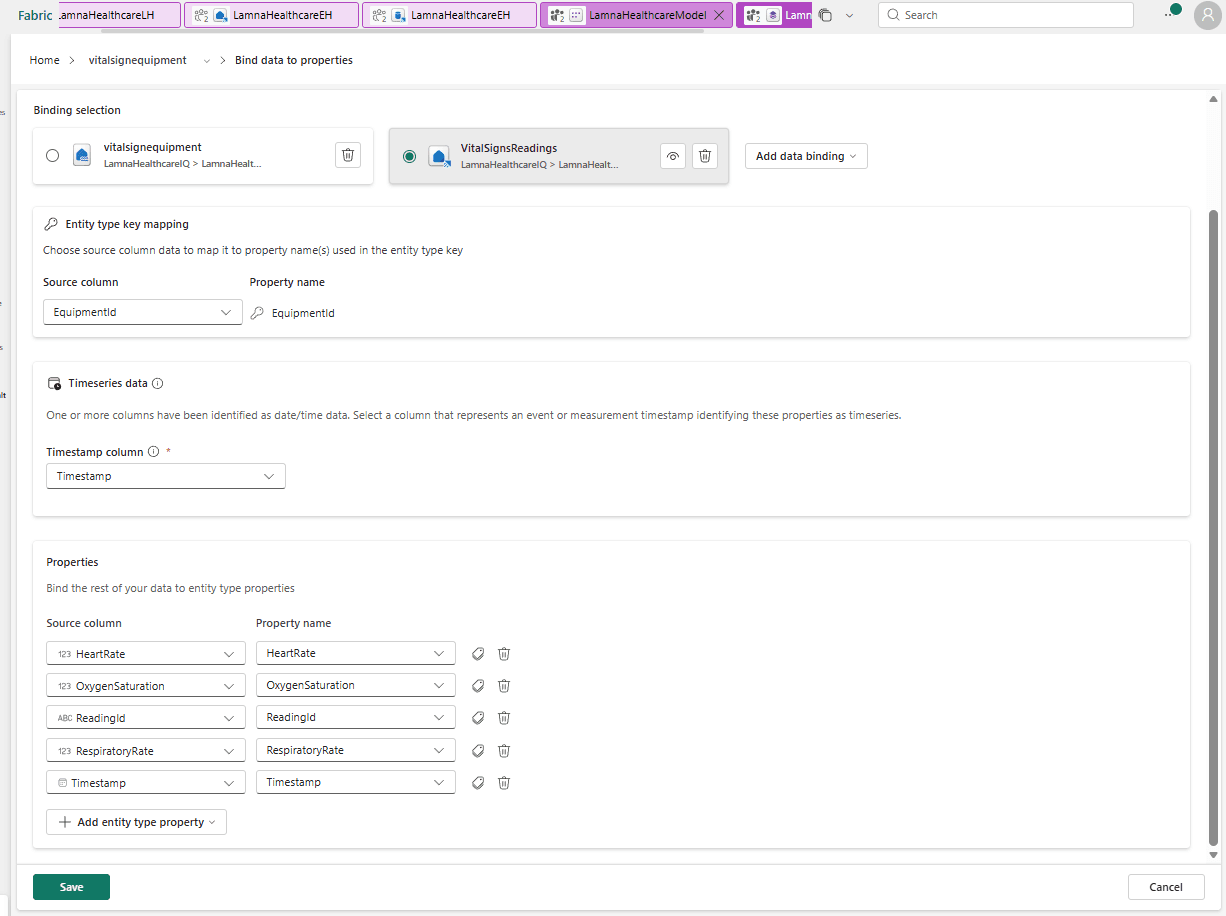
On its Bind data to properties page, Binding selection already holds the lakehouse card generation made for you. Expand Add data binding, take the second option, Eventhouse table or materialized view, and choose LamnaHealthcareEH → VitalSignsReadings.
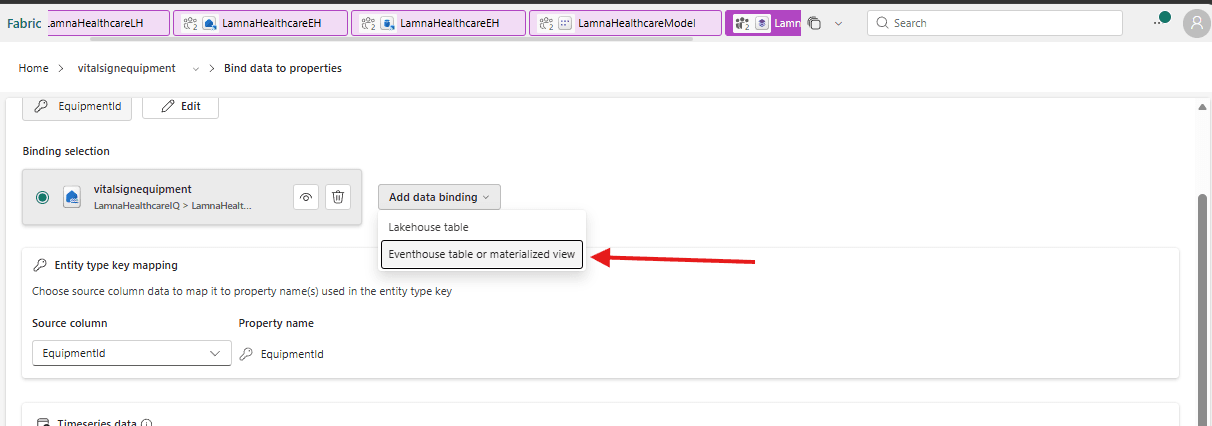
A second card appears, and with it a section the lakehouse binding never showed: Timeseries data. Set Timestamp column to Timestamp — the red asterisk means required, and it's the switch that makes this a time series rather than another flat table.
Check Entity type key mapping reads EquipmentId → EquipmentId, confirm the Properties rows for HeartRate, OxygenSaturation, ReadingId, RespiratoryRate and Timestamp, and Save.
5.4 The meaning, which the generator could never have given you
The lab ends without this step. Every ontology worth building includes it.
Your ontology is now structurally complete and semantically mute. It knows a monitor connects to a patient. It doesn't know that clinicians call it "the monitor", or that OxygenSaturation is what everyone in the building calls SpO2. None of that was in a column, so none of it survived generation.
Names. Generated entity types read vitalsignequipment. Rename where the product allows, because anyone writing a graph query types these by hand.
Display names. Without a display name property, instances label themselves by key — and this sample shows why that hurts. RoomId holds 1 through 10; RoomNumber holds ICU-301, ER-102. The key is the meaningless one, which is correct, keys exist to be stable rather than readable. So set RoomNumber on rooms, a full name on patients, HospitalName on hospitals. One dropdown each, and it decides how legible every later screen is, including every agent answer.
Descriptions and synonyms. On entity types, properties, relationships. None required, all of it read by an agent trying to map a plain-language question onto your graph. "Which patients are in the ICU" only finds DepartmentName = 'ICU' if something connects the word to the column.
This is the City Cart build's lesson exactly: an agent read the graph structure perfectly and still answered wrong, because the meaning of one word was never written down. Generation makes the structural half free, which makes the other half more tempting to skip. The other half was always the hard one.
Part 6: prove it actually works
An unverified ontology is a diagram.
Select rooms and use View Entity Type details. The entity type page has three tabs: Configure, where you have spent all of Part 5, Instances, and Overview.
Open Overview. You'll get "Updating your ontology" while the _graph item builds the nodes and edges. Give it a minute or two, then refresh the browser, because the page doesn't always refresh itself.
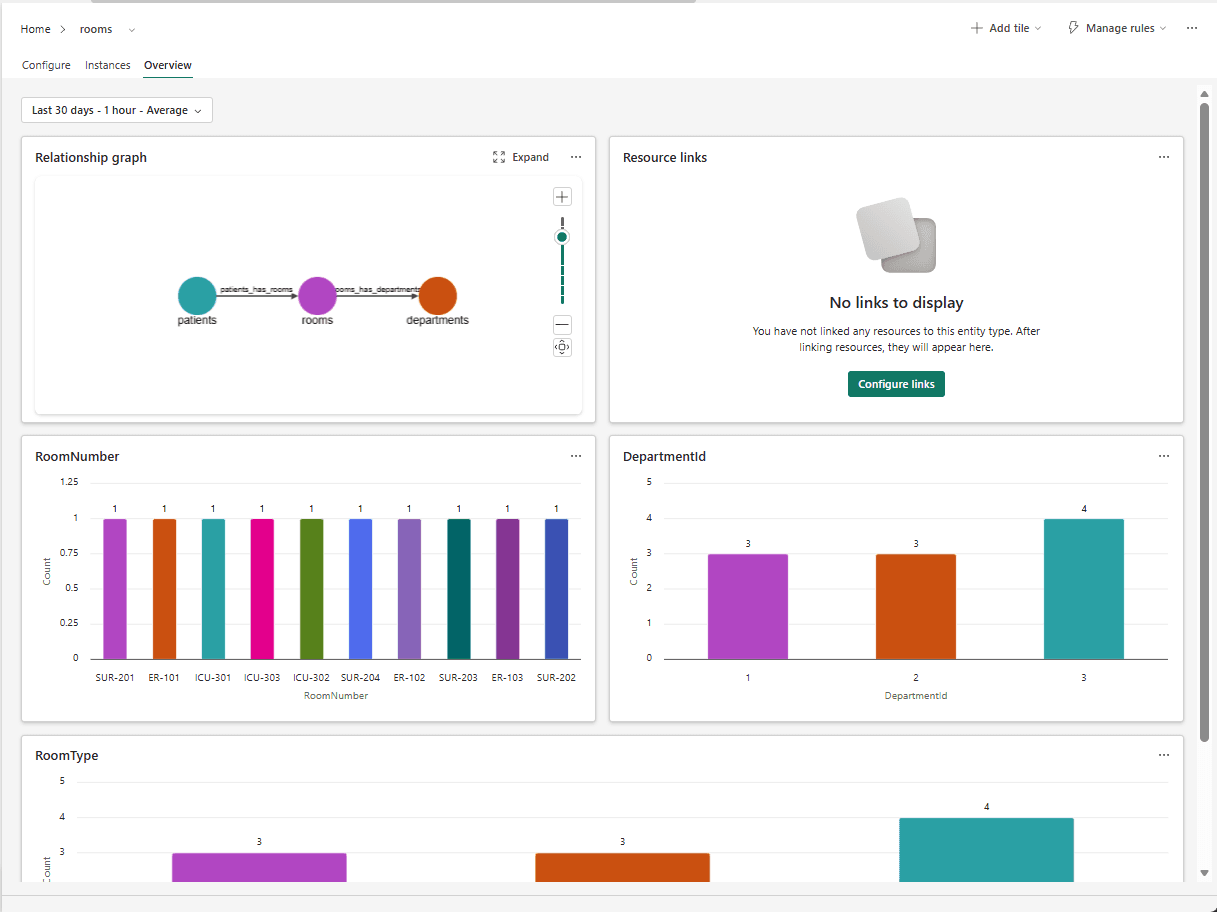
The Relationship graph tile is the fastest proof you have: rooms joined to patients on one side and departments on the other, relationship names on the arrows. A reversed one is still visible here.
Below it Fabric draws one bar chart per property, and those are a free data check. RoomNumber should give ten bars of one, since room numbers are unique. DepartmentId should give 3, 3 and 4 — ICU has three rooms, Emergency three, Surgical four. Wrong numbers mean the binding is reading the wrong column.
Then switch to Instances and check the counts, small enough to verify by eye:
| Entity type | Instances |
|---|---|
hospitals | 1 |
departments | 3 |
rooms | 10 |
patients | 5 |
vitalsignequipment | 5, each with a time series behind it |
Then open ICU-302, the room whose RoomId is 2. You get its department, Intensive Care Unit, and its patient, Casey Morgan. Follow Casey to monitor VS-1002 and the readings are there.
That's instance-level identity, not just a schema. A semantic model gives you average heart rate by department. Only this tells you the person in ICU-302 is Casey Morgan and hands you her trace.
Last, open the _graph item from your workspace. Its Components pane counts Nodes (5) and Edges (4), one per entity type and one per relationship. The canvas draws your five entity types joined by their four named relationships, with a Data load completed timestamp and a Query button. That timestamp is the clearest confirmation you will get that Part 5's bindings landed.
It also gives you a second read on relationship direction. Every arrow should point from child to parent, which is the same many_has_one check as before, drawn instead of spelled.
Read the failures, because they're specific
| What you see | What it means |
|---|---|
| Instances tab empty | Binding wrong or key missing. Back to 5.1 and 5.2 |
| Instances fine, Relationship graph tile bare | The relationship binding was never configured. Back to 5.2 |
| A property's bar chart has the wrong counts | The binding is reading the wrong column. Back to 5.2 |
| Every instance labelled by an ID | No display name property. Cosmetic, 5.4 fixes it |
| Still "Updating your ontology" after five minutes | Refresh. If it persists, a binding points at a table that no longer exists |
vitalsignequipment has instances but no readings | Time-series binding saved without Entity type key mapping. Back to 5.3 |
Run all five entity types, not just rooms. An empty Instances tab is invisible until an agent gives you a confidently wrong answer three weeks later.
What generation actually bought you
| Job | Generated | Still yours |
|---|---|---|
| Five entity types | ✅ | |
| Twenty-five properties, typed | ✅ | |
| Four relationship types, named and directed | ✅ | |
| Four of five keys, probably | ✅ | Verify all five |
| Four relationship bindings | Sometimes | Verify all four |
| The time-series binding | All yours | |
| Names, display names, descriptions, synonyms | All yours |
The structural work collapsed from an afternoon into ten seconds. The semantic work didn't move at all, because it was never in the semantic model to begin with.
Generate Ontology is a transcription tool, not an authoring tool. It copies facts you already wrote down. It cannot write down facts you never did.
When you should not use this path
Your semantic model is a star schema built for reporting. Most production models are, carrying date dimensions nobody would call a business entity, bridge tables that exist only to resolve many-to-many joins, and denormalisation done for speed. Generate from that and you get an ontology shaped like a report, wearing entity types as a costume.
The test: read your relationship lines out loud as sentences. "A department belongs to a hospital" is a business fact. "A fact table joins a date dimension" is a modelling technique. Mostly the second kind? Build by hand, and let the ontology take the shape of the business rather than the warehouse.
You don't already have a semantic model. Building one purely to generate an ontology means declaring every relationship in the Power BI designer, then verifying every one again in the ontology editor. Go straight to the manual build.
Where this goes next
There's a question waiting in this data, worth knowing about even if you stop building today.
Follow monitor VS-1001 across its eight readings, 08:00 to 08:35. Heart rate 78, 82, 85, 88, 90, 92, 95, 98. Oxygen falling 98 to 93. Respiratory rate climbing 16 to 22. Somebody is getting worse — and no single reading trips an alarm, because the highest number anywhere in the file is 98. The other four monitors drift mildly the same way over three readings each, so a threshold can't separate them either. Only the sustained trend does, and seeing it means reading the whole trace.
Then the harder half. VS-1001 is a serial number. To be useful the answer has to say Kerry Allen, room ICU-301, Intensive Care Unit, Lamna Healthcare Regional Medical Center, Seattle, and each of those facts lives in a different table. That sentence is the whole ontology read aloud: the time-series binding gets you the trace, the four relationship bindings get you the name, the room, the ward and the building. Remove any one and the answer degrades back to a serial number.
A data agent pointed at LamnaHealthcareOntology turns the question into that sentence. Two articles here build one, and both apply unchanged:
- The City Cart e-commerce build creates an agent, watches it answer confidently and wrongly, then fixes it with instructions. The shortest demonstration of why 5.4 matters.
- The pharma cold-chain build goes further into time-series questions and adds an operations agent that watches without being asked.
Clean up
To remove everything: select the workspace, Workspace settings, General, Remove this workspace. On a paid capacity, pause it in the Azure portal too — removing the workspace stops the items, not the capacity.
Fresher-to-pro glossary
| Plain words in this article | Official name |
|---|---|
| A model of how tables connect, for reports | semantic model; Direct Lake when it reads OneLake tables in place |
| A model of how tables connect, for traversal and agents | ontology, the Ontology (preview) item |
| One kind of thing the business has | entity type; each real row is an instance |
| Reading a semantic model and restating it as an ontology | Generate Ontology |
| The property whose value picks out exactly one instance | entity type key |
| The property whose value labels an instance on screen | display name property |
| Wiring an entity type to the table holding its rows | binding |
| The table that proves which instance connects to which | the child table, the one carrying the foreign key |
| Data that stays true until someone changes it | static data, in a lakehouse |
| Data where every value carries the moment it was measured | time-series data, in an eventhouse |
| A property whose values each carry a timestamp | time-series property, created by the binding, never declared before it |
| The saved network of nodes and edges built from the bindings | the materialized graph, in the Graph in Microsoft Fabric item |
| The language the graph speaks | GQL (Graph Query Language), the ISO standard; not GraphQL |
| The agent you ask questions in plain language | data agent |